- Mark as New
- Bookmark
- Subscribe
- Mute
- Subscribe to RSS Feed
- Permalink
- Report Inappropriate Content
07-15-2014 01:48 PM
The assignment I have is to create a report that analyzes survey responses we have received over time. Using a bar chart with stacked fields, it should end up looking like this:
Y Axis = Total Count of Survey Responses
X Axis = Time
Group By = Week survey was taken
Stacked By = Responses
The survey part is done. I have a question with 5 multiple choice answers (and values associated with each). Survey is active and responses are being received.
The report is where I am stuck. We are on Calgary. I am using the task_survey_details table. Group by is set to "Taken On". I have filters set for the active survey and question I am looking to track:
Instance(tsdresp_instance).Survey is Service Desk Satisfaction Survey
and Question is Please Rate the Quality of the Work Performed.
So far - so good. Now, my options for stacked fields are limited to only "reference, boolean, and choice lists" (according to the wiki). UNFORTUNATELY, the answers / responses are string fields. So I thought that I should create a reference field that references the answers / responses and use that for the stacked field.
I see that Company (for example) is an option for a stacked field - because it's a reference field. This is where I got the idea to create a reference field that would get the answers / responses (since the Company reference field is just getting the Name of the company from another table - which Name is a string field as well).
I go to create a new reference field on the task_survey table - but the data it returns is not what I was looking for. For the dictionary entry I tried:
Table: task_survey
Column name: u_reponse
Type: Reference
Max Length: 32
Reference: Survey Responses
When I use this new stacked field in the report - called "Response(tsdts_u_response)" - I get the data, but it's not stacking the answers / responses in the bars (they are just solid colors with the totals). Any ideas on what I need to change?
Solved! Go to Solution.
- Mark as New
- Bookmark
- Subscribe
- Mute
- Subscribe to RSS Feed
- Permalink
- Report Inappropriate Content
07-16-2014 01:05 AM
Hi Christopher,
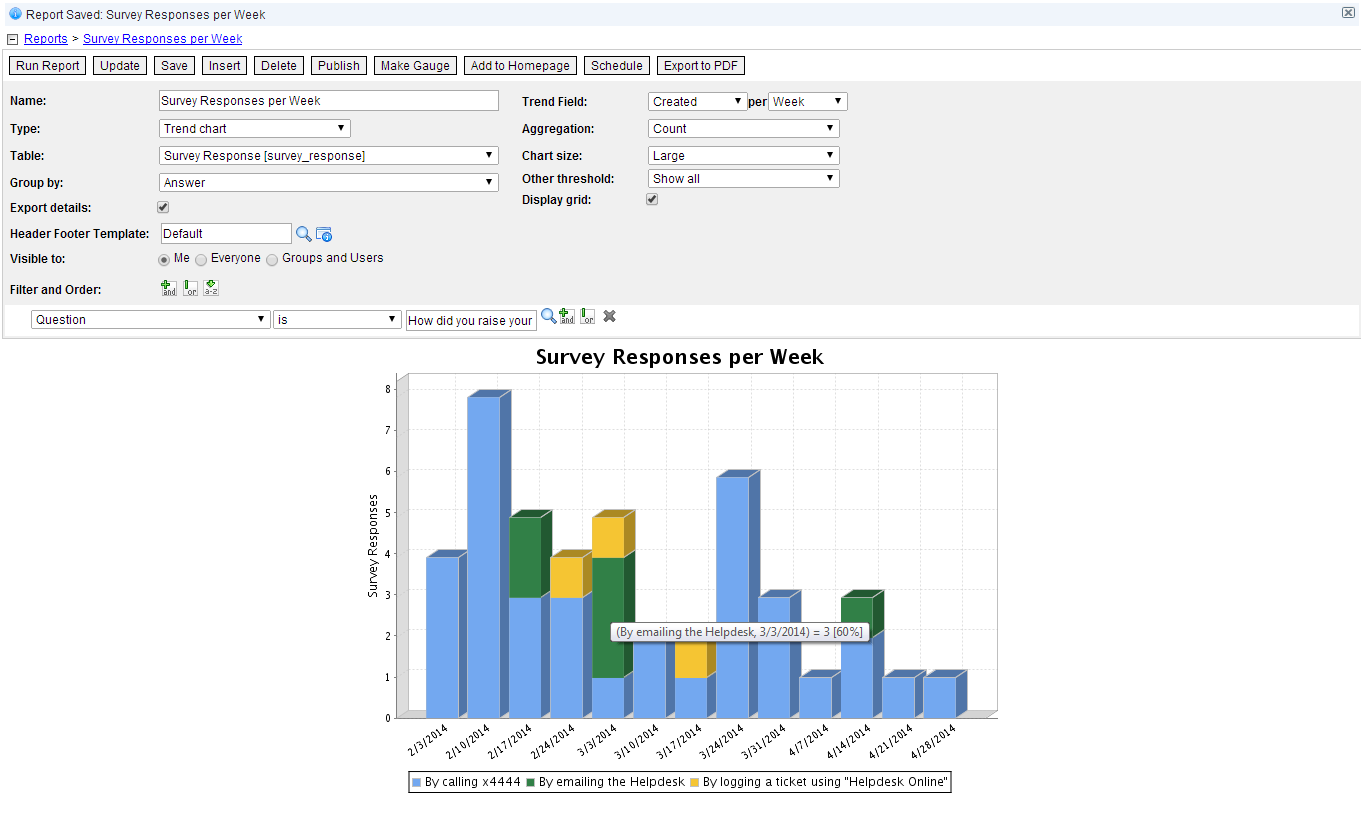
I think I've managed to recreate your requirement on my dev instance. We use the survey_reponse table to track our response (as we used the Survey Wizard as opposed to Task Survey), but I think the config should be fairly similar. Have a look at my attached screenshot and see if it works for you. I used the Trend Chart type and set the Trend field to Created per Week. I grouped by Answer, so that the individual responses showed in separate colors on the chart.
Let me know if this helps.
Thanks, Adam

- Mark as New
- Bookmark
- Subscribe
- Mute
- Subscribe to RSS Feed
- Permalink
- Report Inappropriate Content
07-15-2014 11:10 PM
Hi Christopher,
I would love to help out on this. Could you by chance provide a screenshot of the report options and output? Or at least can you let me know what value is displayed in the legend for the stacked value of the single bar?
- Mark as New
- Bookmark
- Subscribe
- Mute
- Subscribe to RSS Feed
- Permalink
- Report Inappropriate Content
07-16-2014 10:26 AM
Sure! Here is the screenshot of the report options and output. The counts in the vertical bars are correct (only 12 total responses so far - and the dates match when the surveys were taken). That custom reference field I created (which I listed the details for in my first post) is just not wanting to cooperate with referencing the answers...

- Mark as New
- Bookmark
- Subscribe
- Mute
- Subscribe to RSS Feed
- Permalink
- Report Inappropriate Content
07-16-2014 01:05 AM
Hi Christopher,
I think I've managed to recreate your requirement on my dev instance. We use the survey_reponse table to track our response (as we used the Survey Wizard as opposed to Task Survey), but I think the config should be fairly similar. Have a look at my attached screenshot and see if it works for you. I used the Trend Chart type and set the Trend field to Created per Week. I grouped by Answer, so that the individual responses showed in separate colors on the chart.
Let me know if this helps.
Thanks, Adam
- Mark as New
- Bookmark
- Subscribe
- Mute
- Subscribe to RSS Feed
- Permalink
- Report Inappropriate Content
07-16-2014 10:31 AM
This worked great Adam - thank you very much!
The one thing I changed was: Trend Field = Updated per Week
Did this so that the report reflects when the survey was taken (or updated) as opposed to when it was created. This will hopefully be closer to the "Taken On" field in the task_survey_details table.
This definitely gets me the report I was looking for (marking it as the correct answer), but if you if have any ideas about the custom reference field (since that mystery is still bugging me) I would be happy to hear that as well.
Thanks guys!