- Mark as New
- Bookmark
- Subscribe
- Mute
- Subscribe to RSS Feed
- Permalink
- Report Inappropriate Content
04-16-2021 03:39 PM
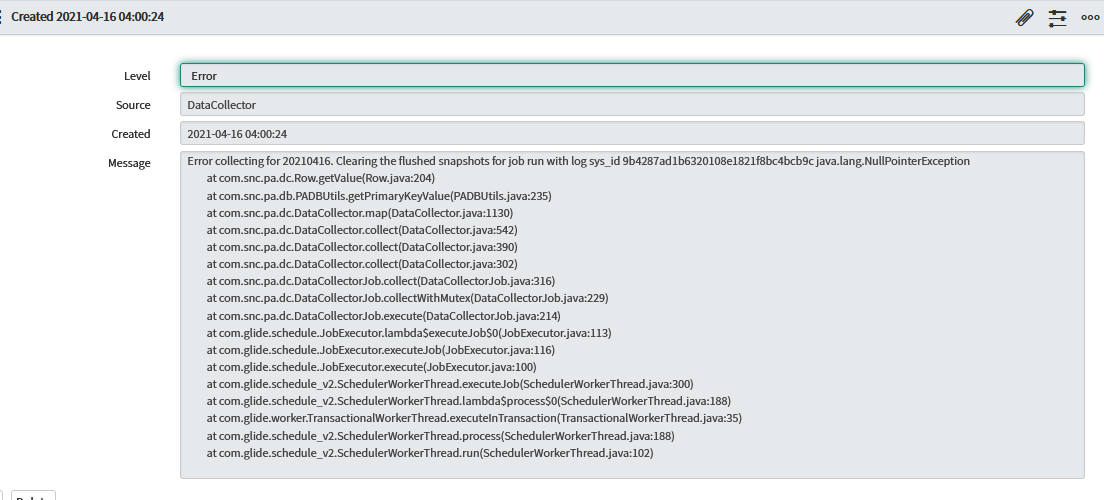
For the first time in the over 2 years we've been using ServiceNow, I got an email in my SNow admin email account with subject "[PA AppSec] Daily Data Collection completed with error". I found the PA job log and filtered for Level = error and got the error below. PDFs, screenshots attached. Does anyone have any idea what could have generated this or where I should look to find more information? Thanks in advance for any help!
Error collecting for 20210416. Clearing the flushed snapshots for job run with log sys_id 9b4287ad1b6320108e1821f8bc4bcb9c java.lang.NullPointerException
at com.snc.pa.dc.Row.getValue(Row.java:204)
at com.snc.pa.db.PADBUtils.getPrimaryKeyValue(PADBUtils.java:235)
at com.snc.pa.dc.DataCollector.map(DataCollector.java:1130)
at com.snc.pa.dc.DataCollector.collect(DataCollector.java:542)
at com.snc.pa.dc.DataCollector.collect(DataCollector.java:390)
at com.snc.pa.dc.DataCollector.collect(DataCollector.java:302)
at com.snc.pa.dc.DataCollectorJob.collect(DataCollectorJob.java:316)
at com.snc.pa.dc.DataCollectorJob.collectWithMutex(DataCollectorJob.java:229)
at com.snc.pa.dc.DataCollectorJob.execute(DataCollectorJob.java:214)
at com.glide.schedule.JobExecutor.lambda$executeJob$0(JobExecutor.java:113)
at com.glide.schedule.JobExecutor.executeJob(JobExecutor.java:116)
at com.glide.schedule.JobExecutor.execute(JobExecutor.java:100)
at com.glide.schedule_v2.SchedulerWorkerThread.executeJob(SchedulerWorkerThread.java:300)
at com.glide.schedule_v2.SchedulerWorkerThread.lambda$process$0(SchedulerWorkerThread.java:188)
at com.glide.worker.TransactionalWorkerThread.executeInTransaction(TransactionalWorkerThread.java:35)
at com.glide.schedule_v2.SchedulerWorkerThread.process(SchedulerWorkerThread.java:188)
at com.glide.schedule_v2.SchedulerWorkerThread.run(SchedulerWorkerThread.java:102)
Solved! Go to Solution.
- Mark as New
- Bookmark
- Subscribe
- Mute
- Subscribe to RSS Feed
- Permalink
- Report Inappropriate Content
05-07-2021 02:33 PM
- Mark as New
- Bookmark
- Subscribe
- Mute
- Subscribe to RSS Feed
- Permalink
- Report Inappropriate Content
05-24-2021 07:29 AM
Hi, The root case of this was identified as corrupted Index file in Performance Analytics Text Index Configurations for indicator source.
Deleting the corrupted file solved the issue. We performed below steps for deletion. Please try these steps in some sub-prod instance first if it works for you.
1. Open the impacted job
2. Go to the corresponding Indicator and then the Indicator source
3. In the related list of Indicator Source - 'Performance Analytics Text Index Configurations ' , open the corresponding record which is associated with the date you see in error i.e Error collecting for 20210521. Clearing the flushed snapshots for job run with log sys_id
4. From the list , Delete the file generated for date / month mentioned in step 3
5. Execute the PA job.
6. Verify if the job is successful and the data is correct.
7. Rerunning the job should also regenerate the file again in Performance Analytics Text Index Configurations
Thanks
Surabhi
- Mark as New
- Bookmark
- Subscribe
- Mute
- Subscribe to RSS Feed
- Permalink
- Report Inappropriate Content
05-24-2021 07:53 AM
Thank you Surabhi for your help. I will try it.
Marek
- Mark as New
- Bookmark
- Subscribe
- Mute
- Subscribe to RSS Feed
- Permalink
- Report Inappropriate Content
05-07-2021 02:33 PM
- Mark as New
- Bookmark
- Subscribe
- Mute
- Subscribe to RSS Feed
- Permalink
- Report Inappropriate Content
10-03-2021 05:50 PM
This link doesn't go to a kb article about the problem or to a potential resolution.
Apparently this has not been resolved. Our instance just started generating these messages today and we don't have PA activated.
- Mark as New
- Bookmark
- Subscribe
- Mute
- Subscribe to RSS Feed
- Permalink
- Report Inappropriate Content
11-12-2021 06:58 AM
This link is not working correctly - having trouble accessing KB0799486