UI Builder Data Visualization Group By (Cannot Dot Walk)
- Mark as New
- Bookmark
- Subscribe
- Mute
- Subscribe to RSS Feed
- Permalink
- Report Inappropriate Content
12-27-2023 11:59 AM
In migrating over from Dashboards to Workspace and creating a landing page with Data Visualization Components, I need to recreate the same type of Dashboard reports I have in Classic UI within Workspace.
I have for the life of me been struggling to get the data visualizations configured.
Can anyone provide some advise or a link to some articles that might be able to assist?
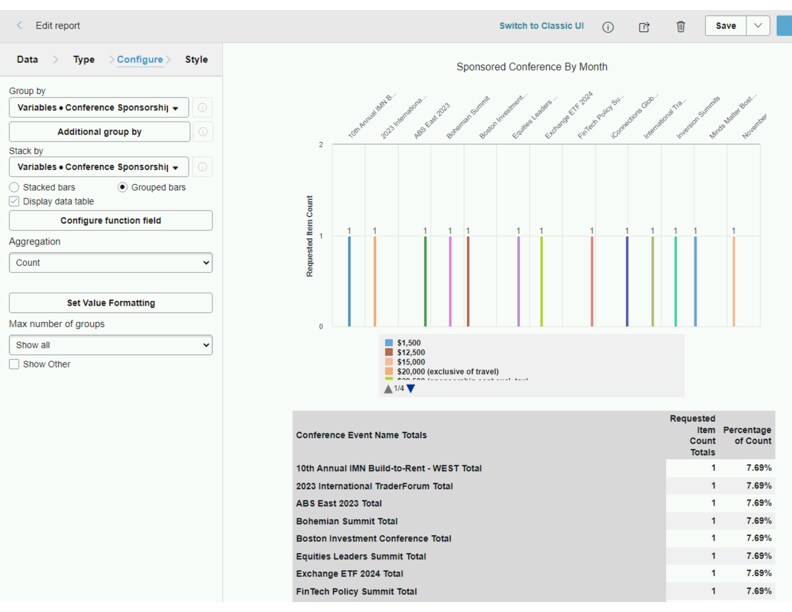
See attached example of what I am trying to create in Workspace
Thank you
Tricia
I Have a Bar Chart
Table sc_req_item
Group By a variable Variables.Cost of Attending
And Stacked by Variables.Conference Name
Display Data Labels
Show Legend
- Mark as New
- Bookmark
- Subscribe
- Mute
- Subscribe to RSS Feed
- Permalink
- Report Inappropriate Content
12-27-2023 09:10 PM
Hi @triciav
Yes you can build a Data Visualization Column type, and set Group By the Catalog Variable.

Ref: Bar Visualization Usage
Cheers,
Tai Vu
- Mark as New
- Bookmark
- Subscribe
- Mute
- Subscribe to RSS Feed
- Permalink
- Report Inappropriate Content
12-28-2023 08:03 AM