


Eric Weischedel

ServiceNow Employee
Options
- Subscribe to RSS Feed
- Mark as New
- Mark as Read
- Bookmark
- Subscribe
- Printer Friendly Page
- Report Inappropriate Content
12-12-2018
04:15 PM
A question or request that Customer Support commonly receives from our users is whether there is a way to create a report that will display data from two or more datasets. The answer to this question, to the positive feedback from our users is a definite Yes.
In this blog post we will show how with a simple example which can, of course, be expended to much more complex and informative user generated reports. This example is designed for use with the newer Report Designer User Interface, but note that similar steps can be used and followed for usage with the original Report Builder User Interface.
Here's the difference between Report Designer and Report Builder.
Step 1: Get started with a basic report
Before starting any report, particularly a report that is intended to use multiple datasets is to take a few moments to plan the report, including the datasets to be used, the formatting and the type of report to be created. Having this information in mind before beginning creation of a new report will help prevent having to backtrack and ensure the report contain information that will be useful to the consumers of that report.
For this example, let's create a basic report which will display the number of Incidents and Problems which are assigned to various assignment groups in our organization. We will filter this report as per a specific date range and display the results as a bar chart, showing the total counts for both Incidents and Problems as assigned, all on the same chart.
We will filter this report as per a specific date range and display the results as a bar chart, showing the total counts for both Incidents and Problems as assigned, all on the same chart.
Step 2: Creating a report based on Multiple Datasets
To begin, ensure to be logged into the instance with an account having necessary to create reports as well as view the specific data for which you intend to report on.
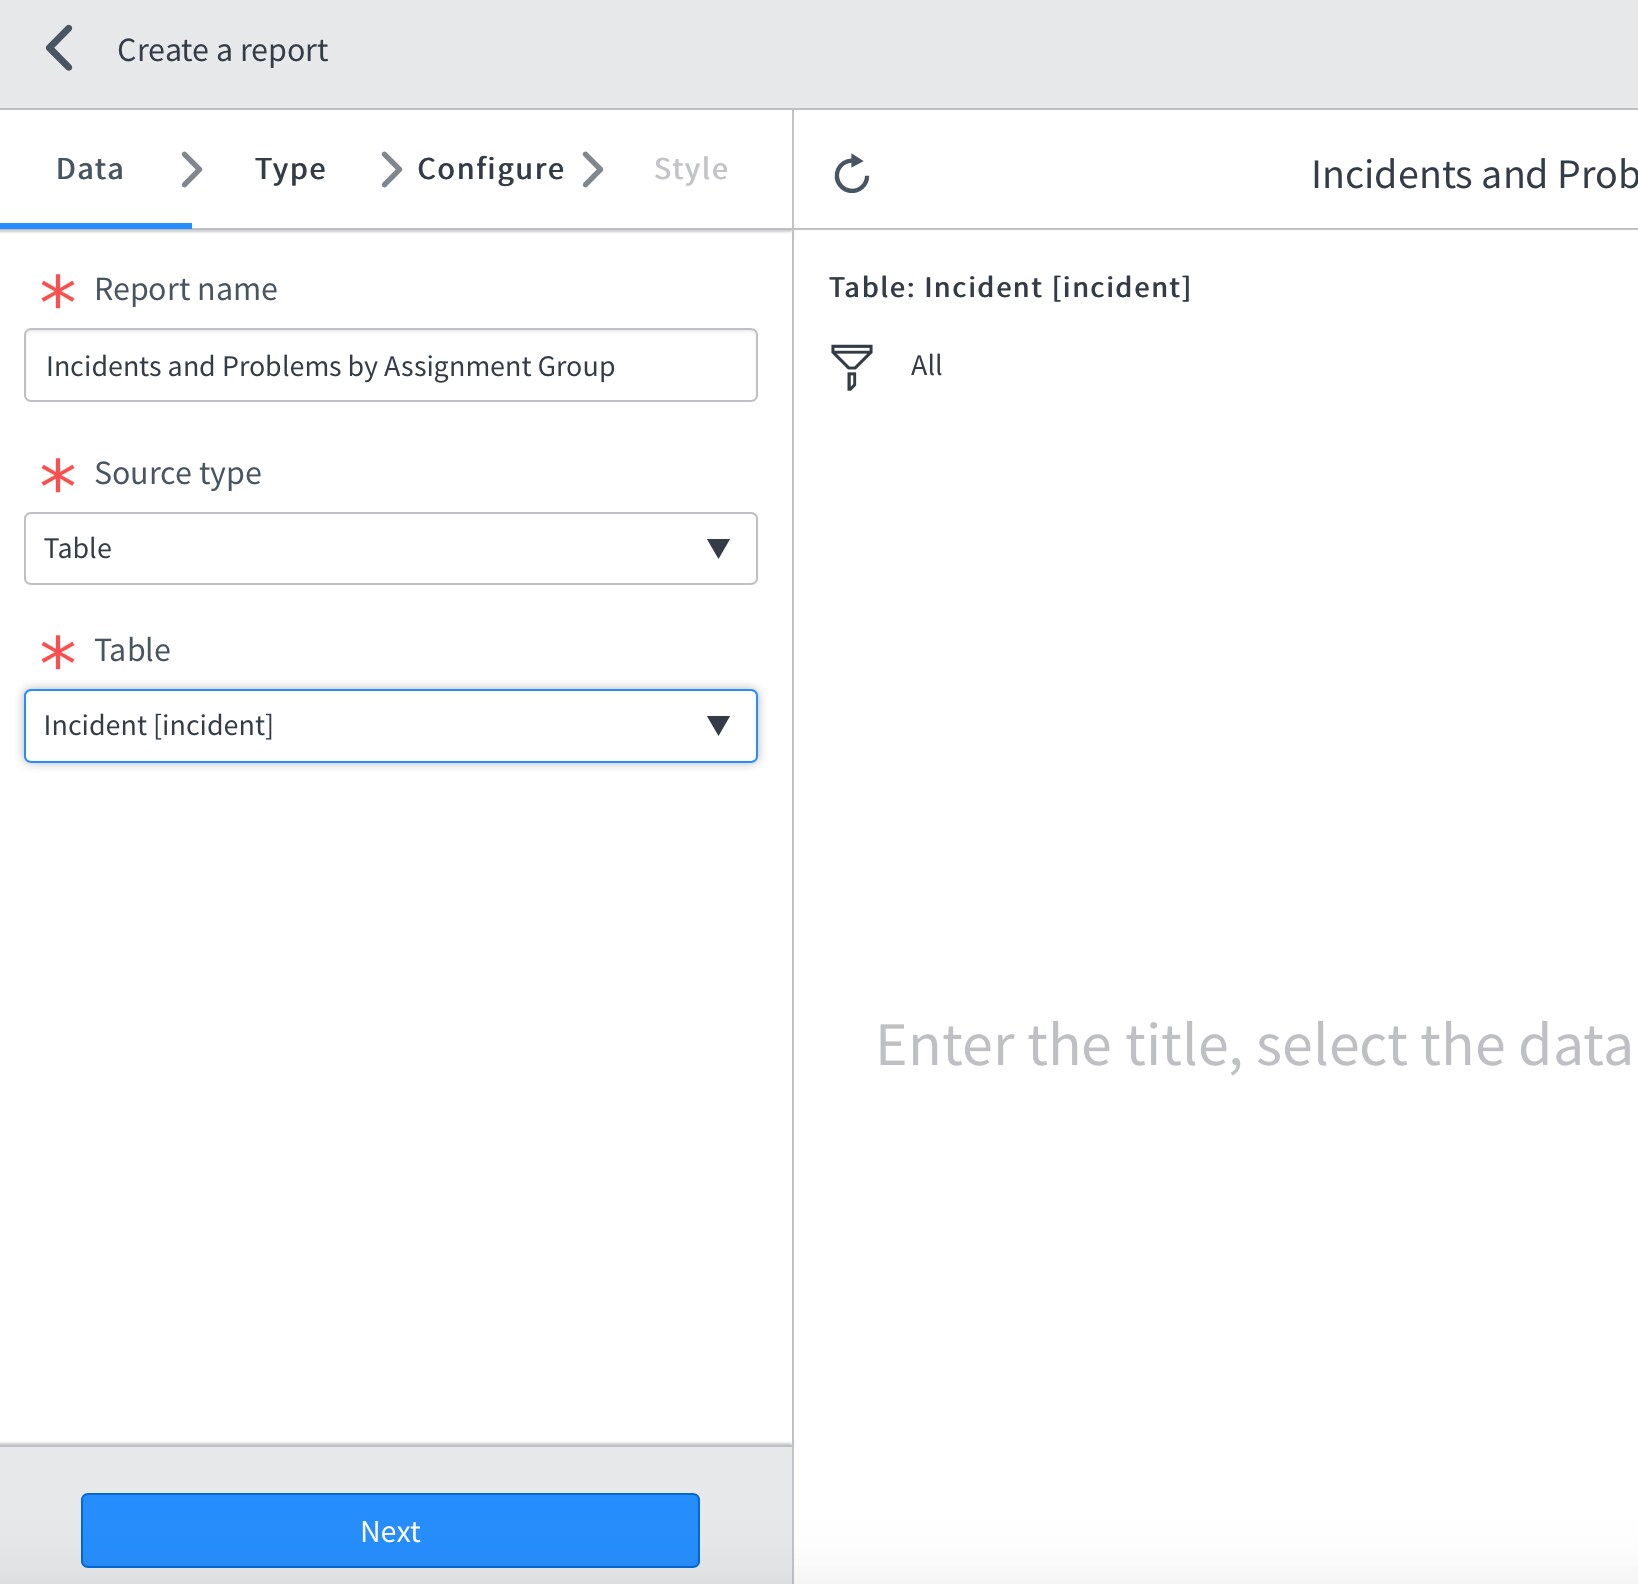
1. From the Menu Navigator on the instance, browse to the location: Reports > Create New. The new report form will appear.
- Give the report a descriptive name and select a source type for the report.
- For this example we will be querying the tables directly, so we have selected the option table, but Report Source could have been used just as easily.
- If selecting the table as the source type, select one of the tables you intend to query and display data from (for our example we will start with Incident).
2. Once the necessary fields have been populated in the Data tab of the Report Designer Interface, click the Next button to advance to the next tab.
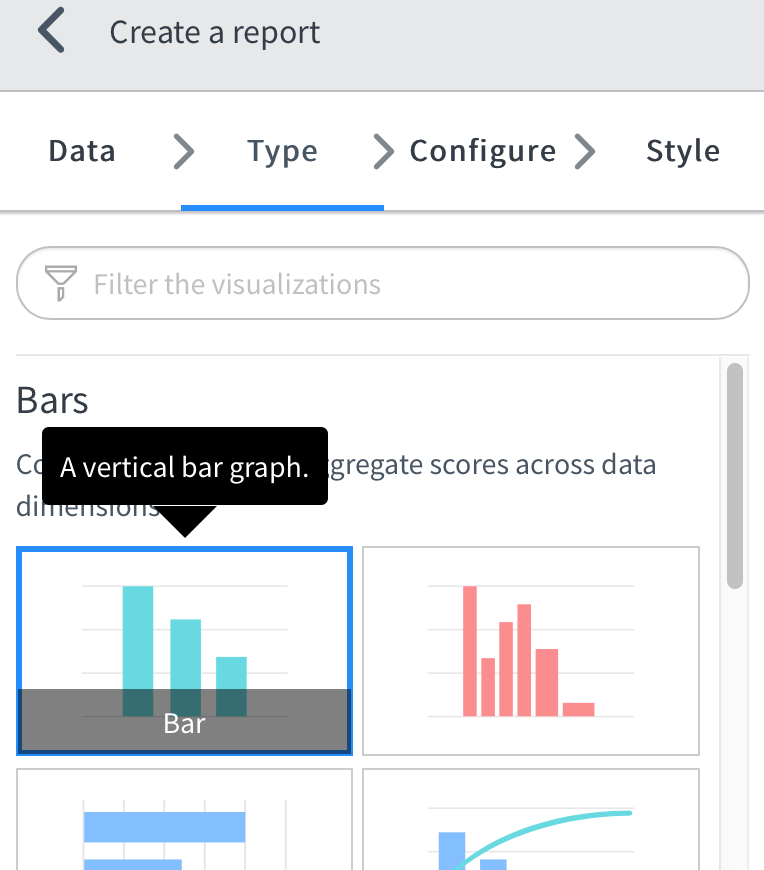
- On this tab (Type), select the appropriate report display type you intend to have both datasets in the report adhere to.
- In this example we will select a Bar graph.
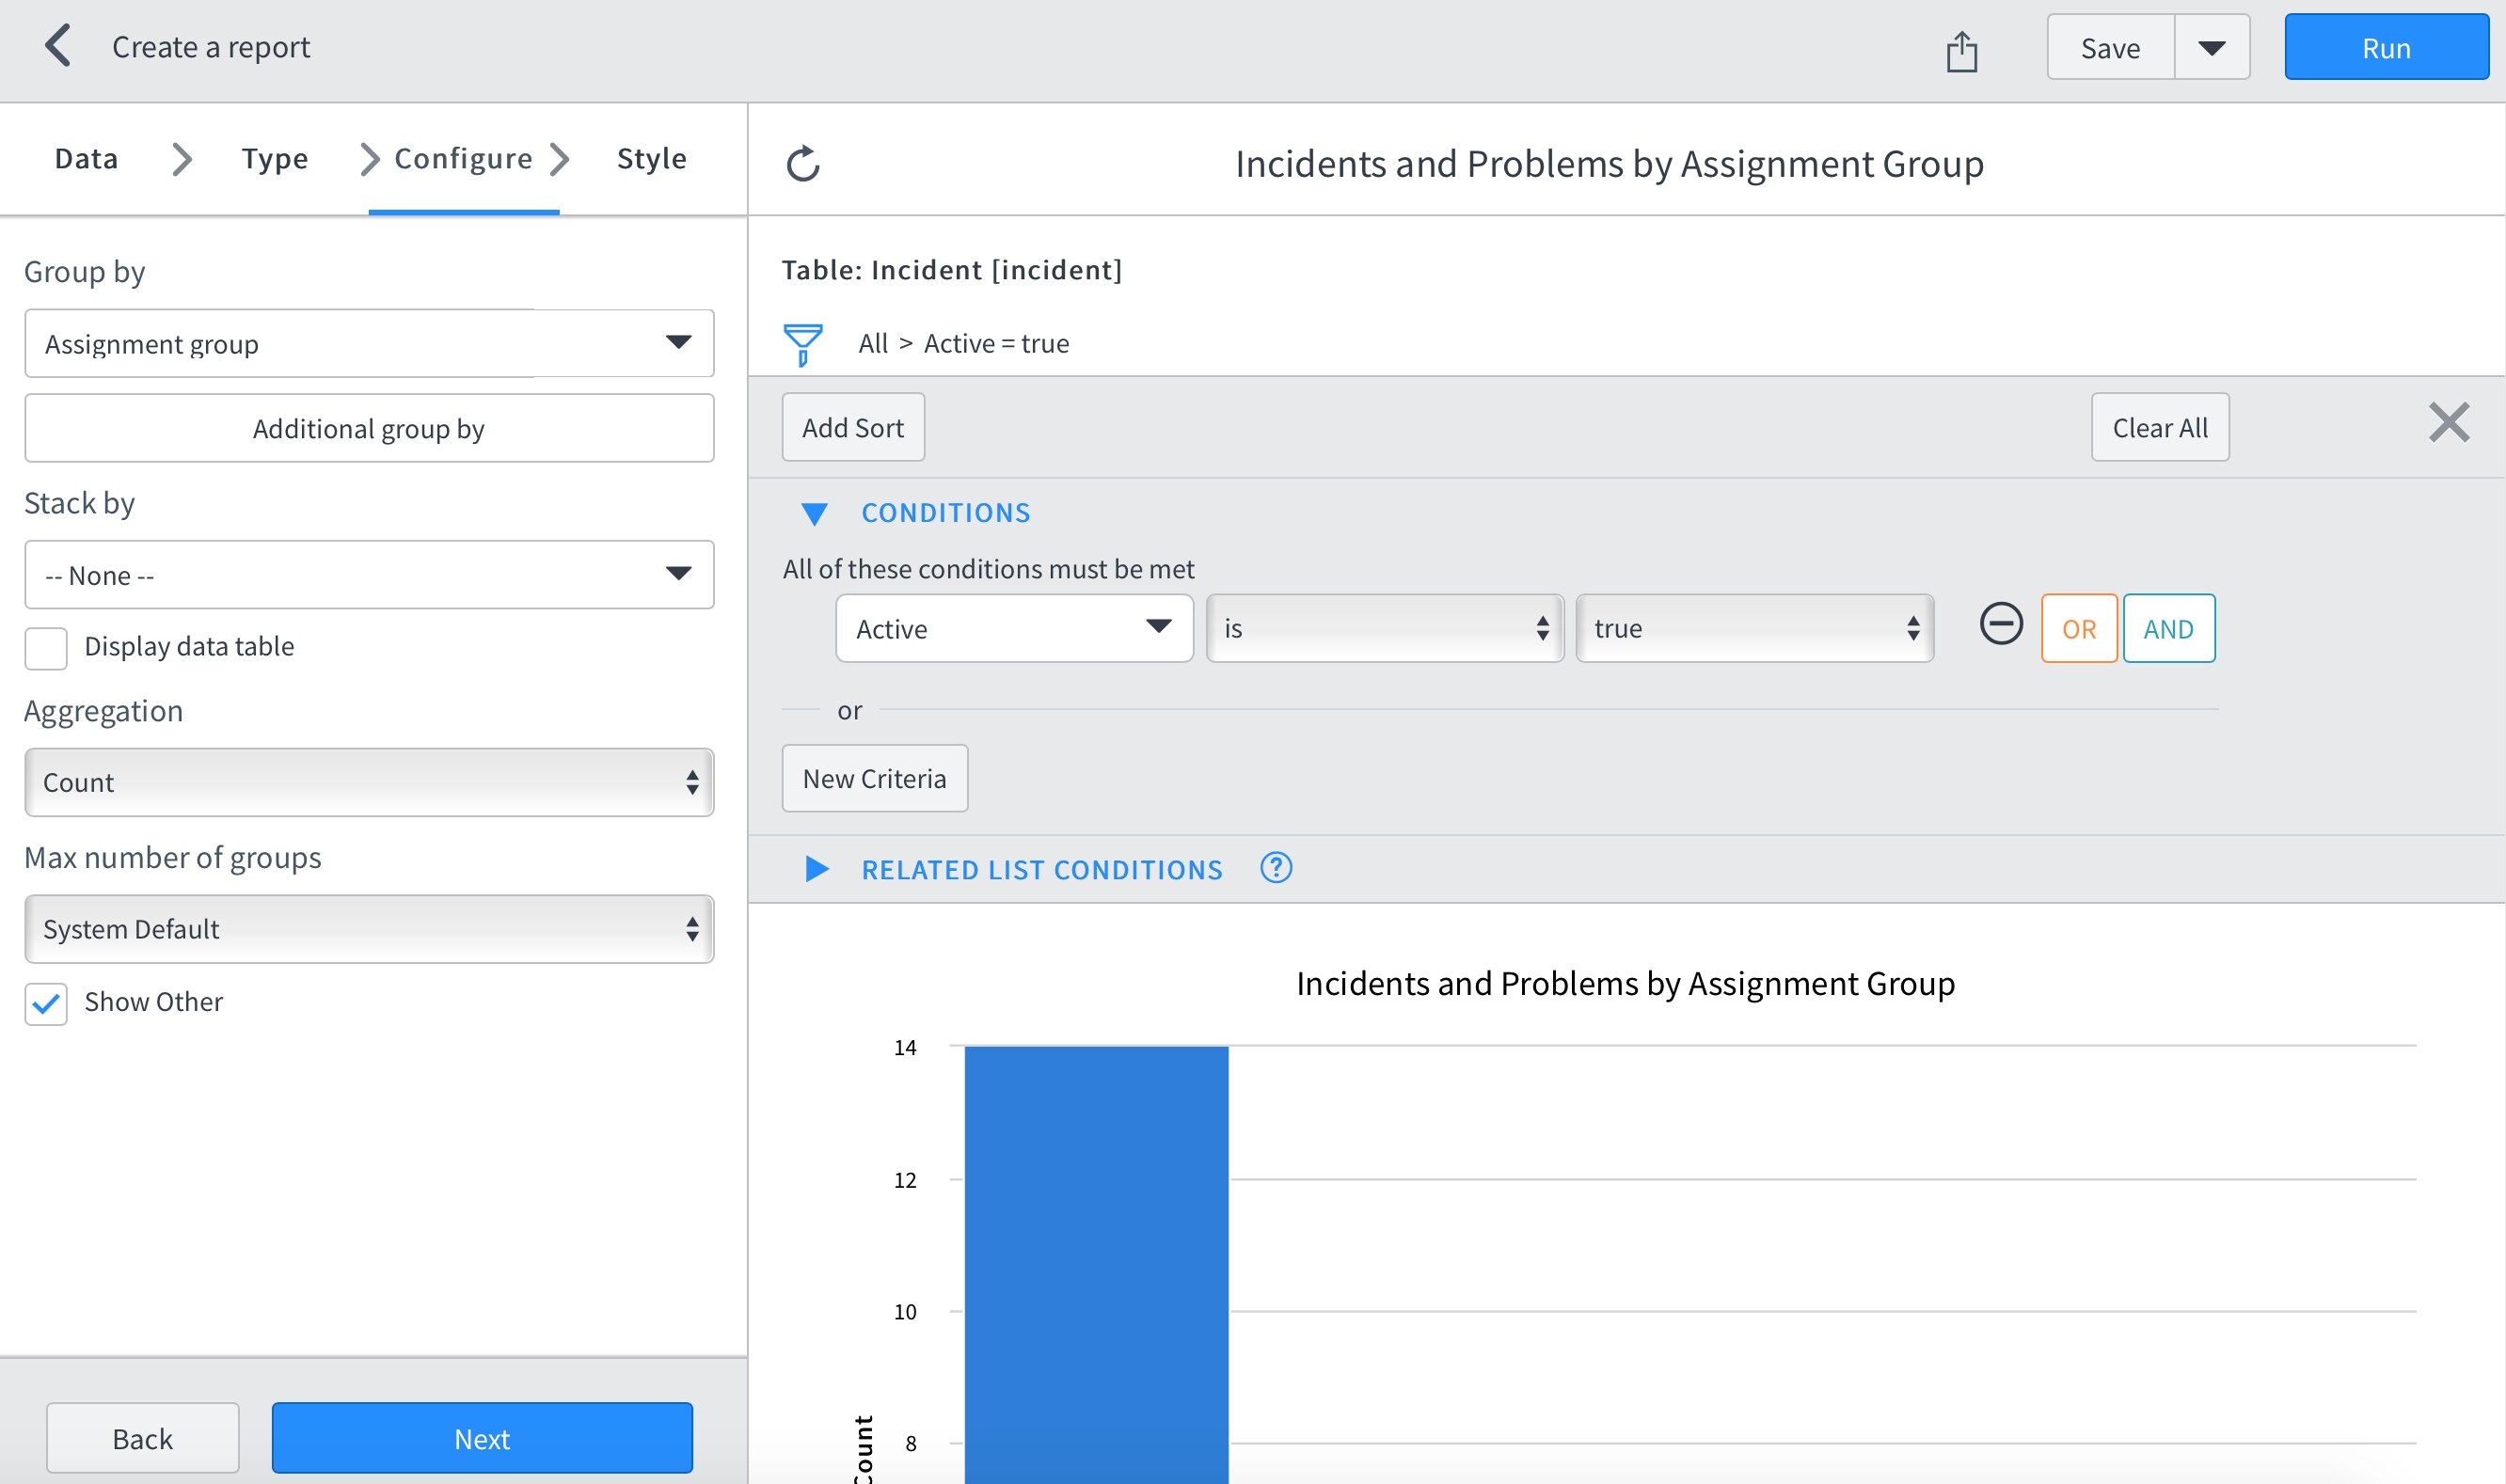
3. After selecting the appropriate report type, click the Next button to advance to the Configure tab.
- From this tab, the specifics of the data to be displayed are selected and modified.
- For our example, we will select to Group by the Assignment Group field, and we will choose to Aggregate the report on a Count of records.
- Clicking the Filter icon on the right pane will allow us to specify criteria to limit the data which will be included in this report (for this example we have specified to display tickets that are currently in an Active status).
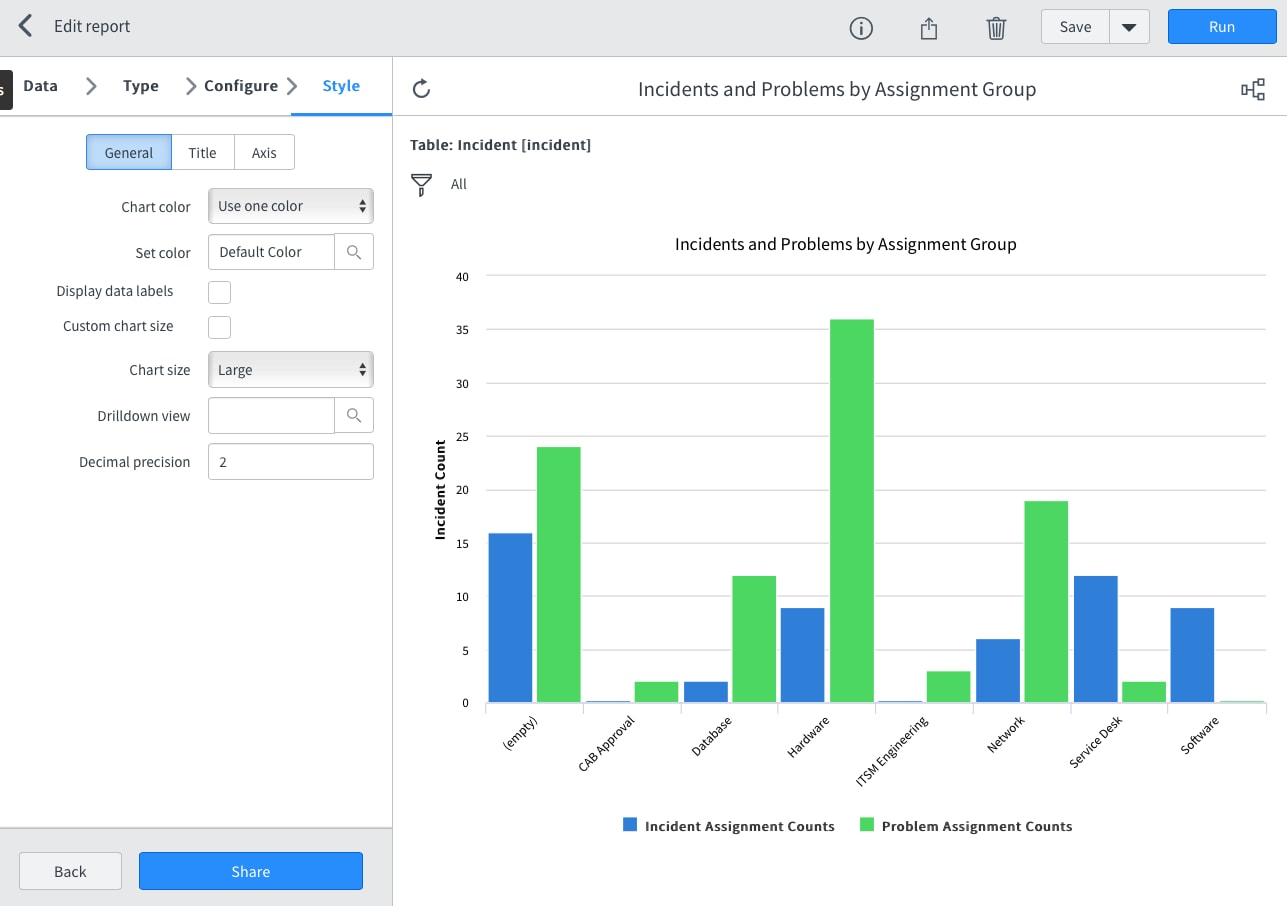
4. Click the Next button to advance to the final tab in the report designer interface, titled Style.
- On this tab, various changes can be made to the report that modify the way it displays for the end users (this includes data labels, chart colors, etc).
- Once satisfied with the display of the report, click the Save button to save this first portion of the report.
Step 3: Display data from different tables and data sources on the same graph
At this point we currently have a complete (albeit rather simple) report that could be used, shared and published. However, we can also associate the report to additional data sets to allow display of data from differing tables and data sources on the same graph display. Thus, to add an additional data set, we will continue with the following steps:
Re-open the report we have just created for editing.
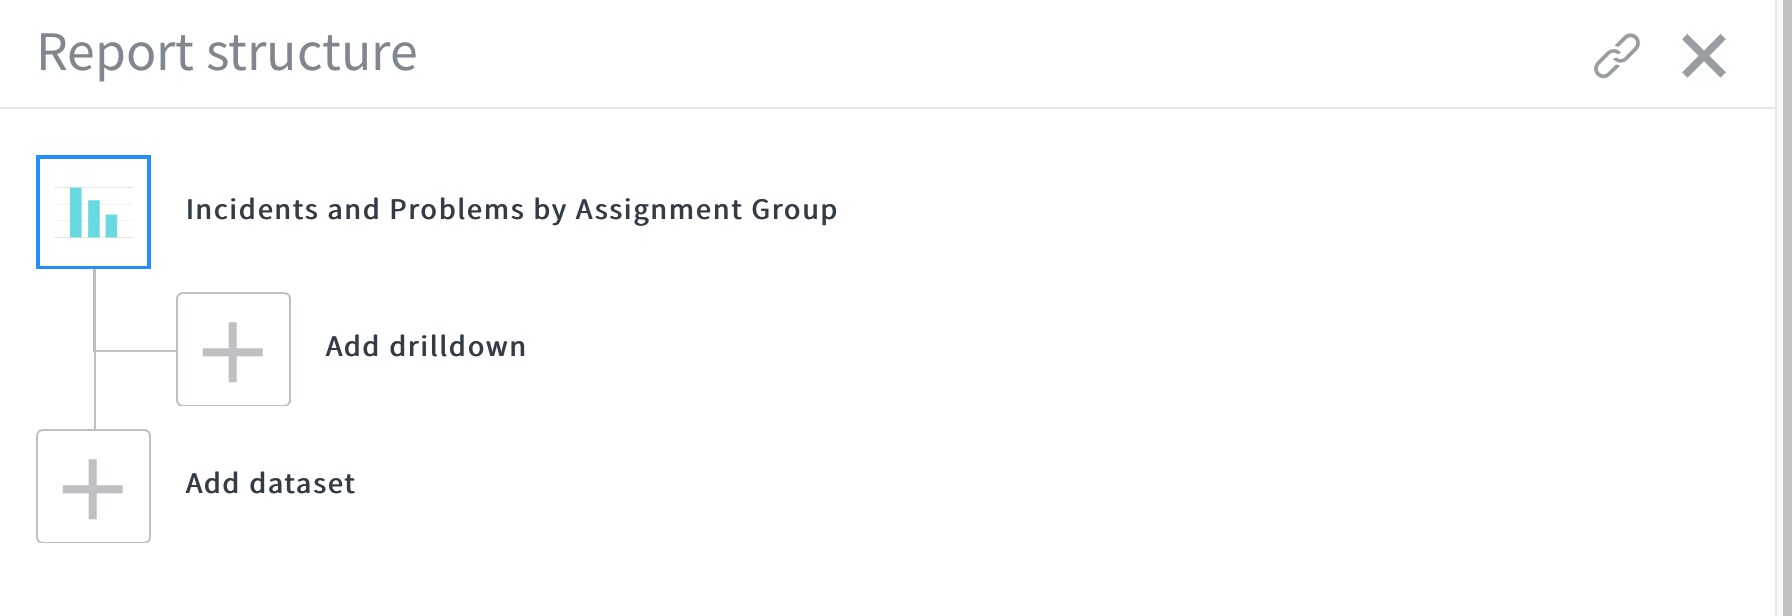
1. Click the Show report structure icon in the upright right corner of the report record display.
The report structure section of the report builder page will expand, showing the current structure of this report, including additional data-sets used as well as any drill-down reports which have been associated to this report.
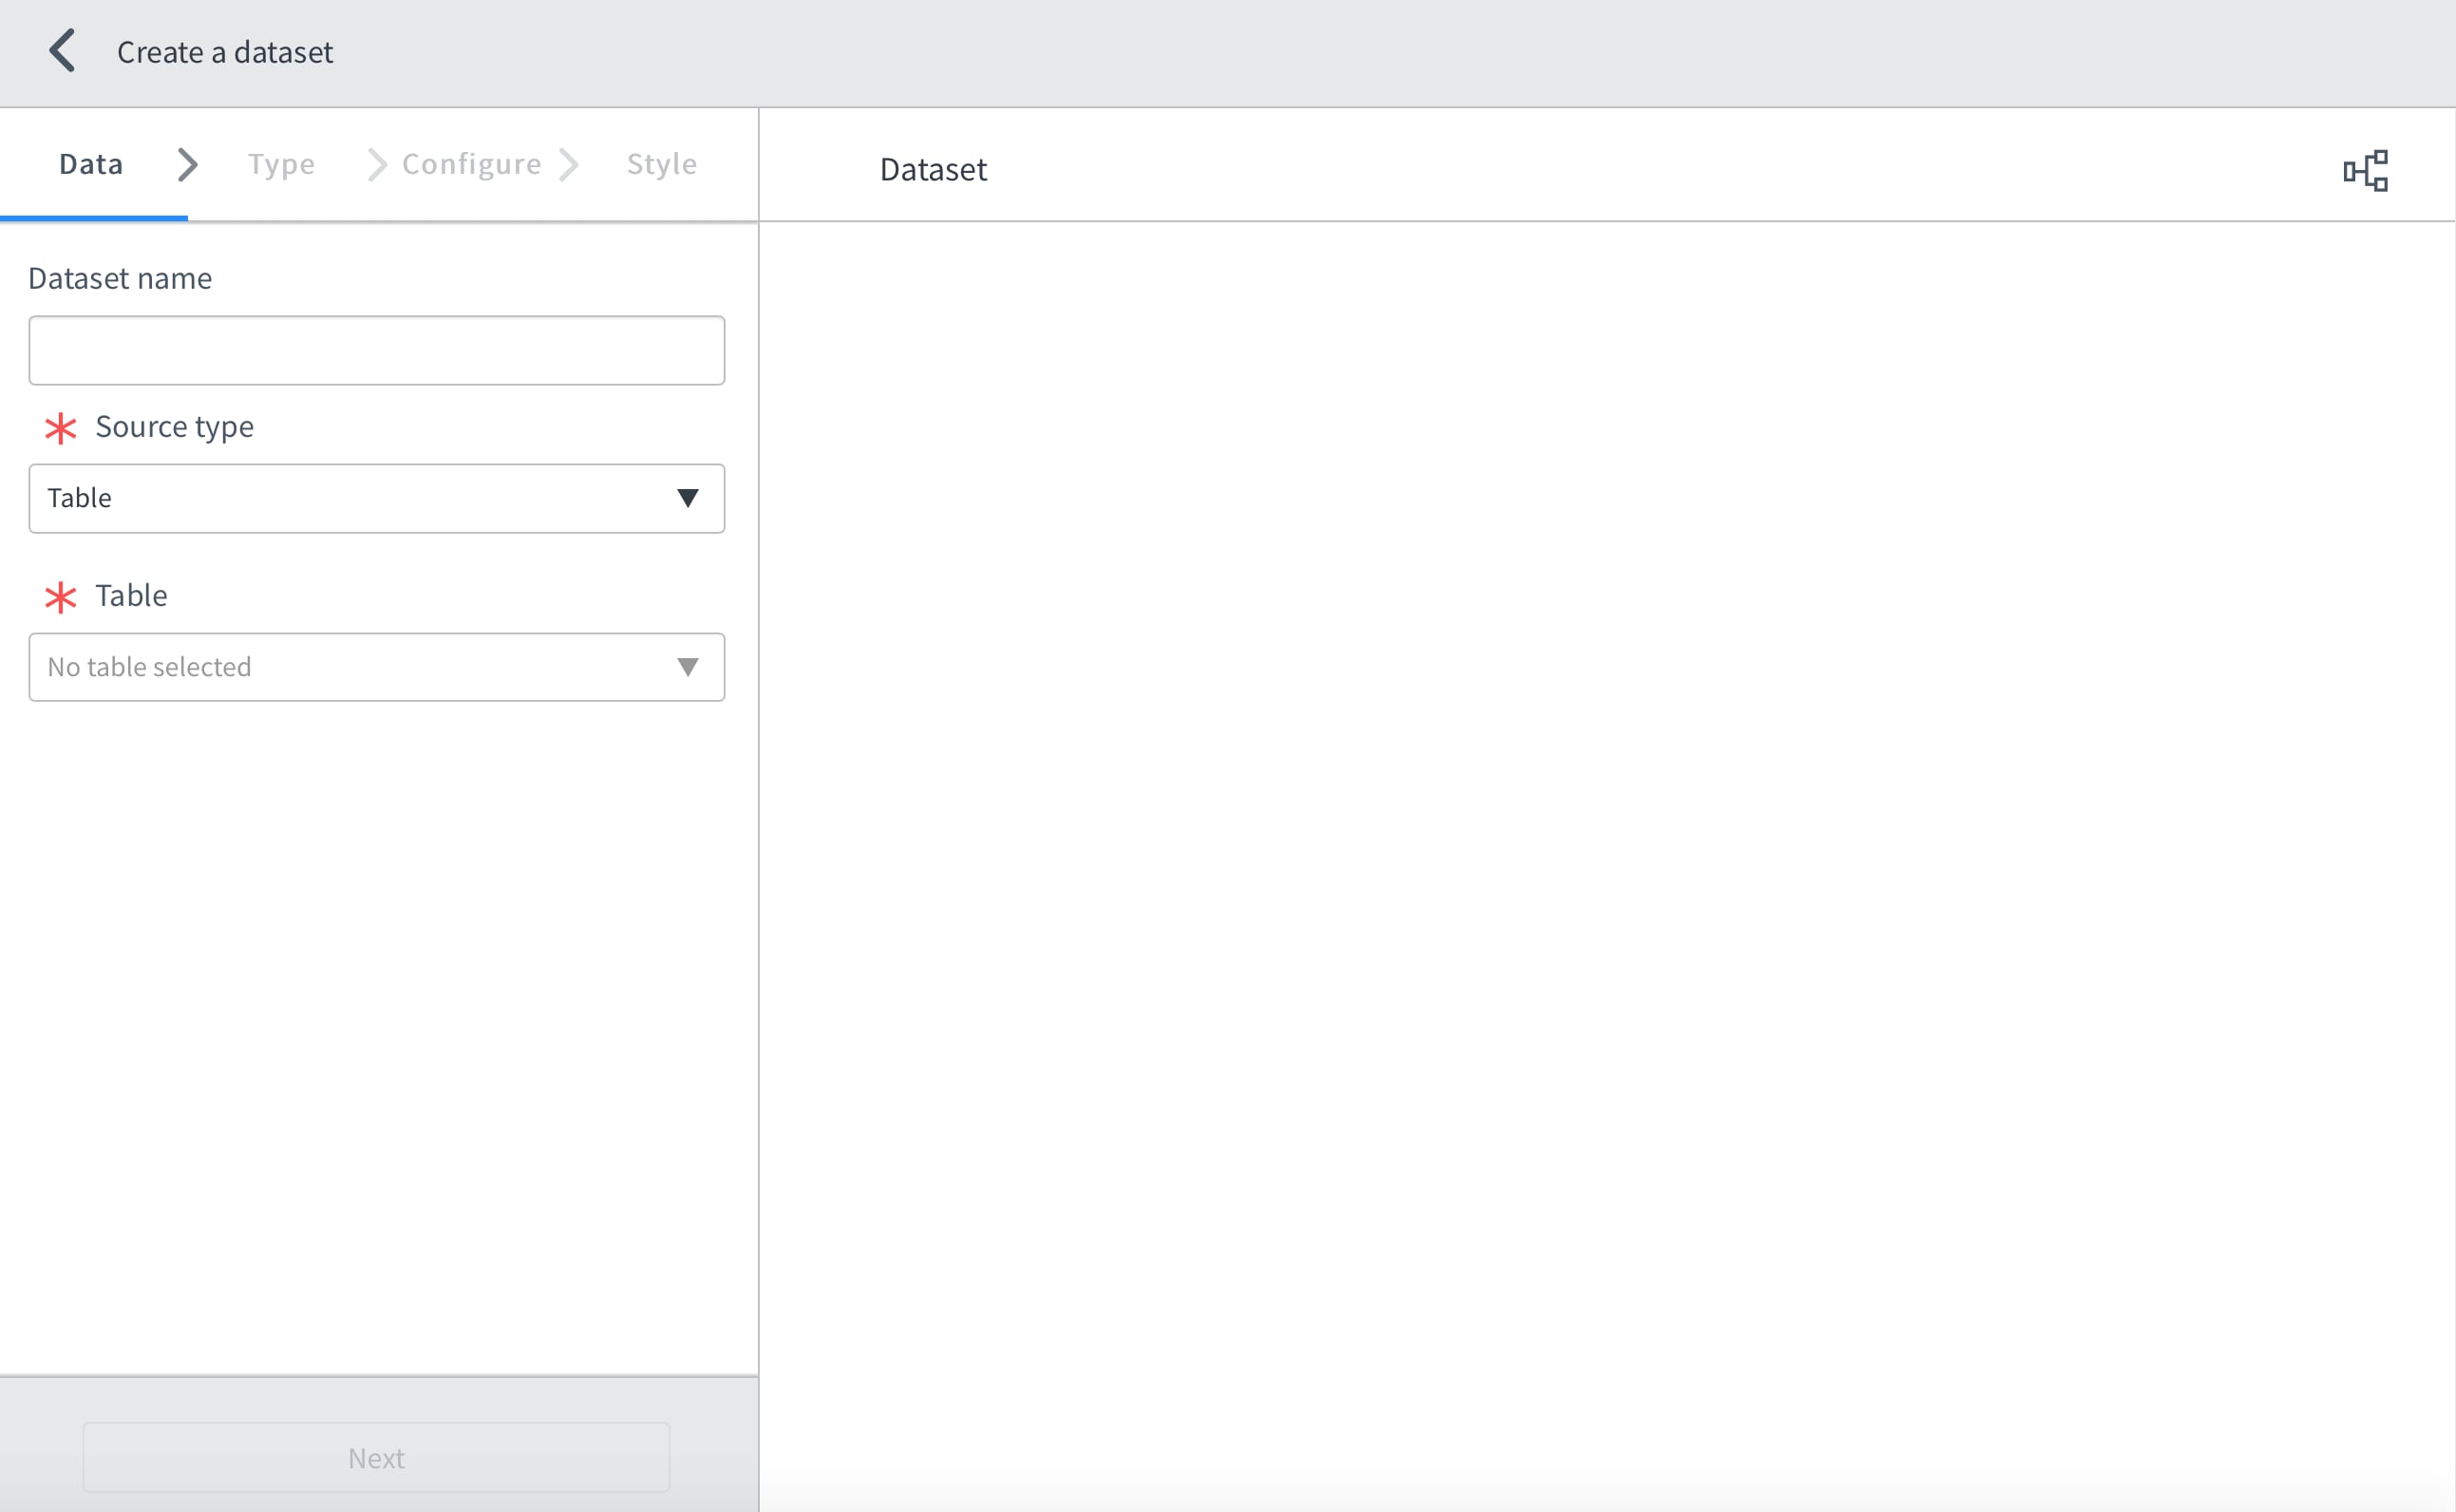
2. Click the Add dataset button. A new, blank dataset record form will appear in a pop-up dialog window.
3. Provide a name for new Dataset record in the Dataset name field. Note that the name provided for this Dataset name field will also appear in the legend corresponding to this dataset in the final report.
4. Select the appropriate Source type and specific Report source or Table for which this subset of data will base it's information. For this example, we will select Table as the Source Type and Problem as the Table to obtain the data from.
5. After filling in the appropriate data, click the Next button to advance to the Type tab of the Dataset record.
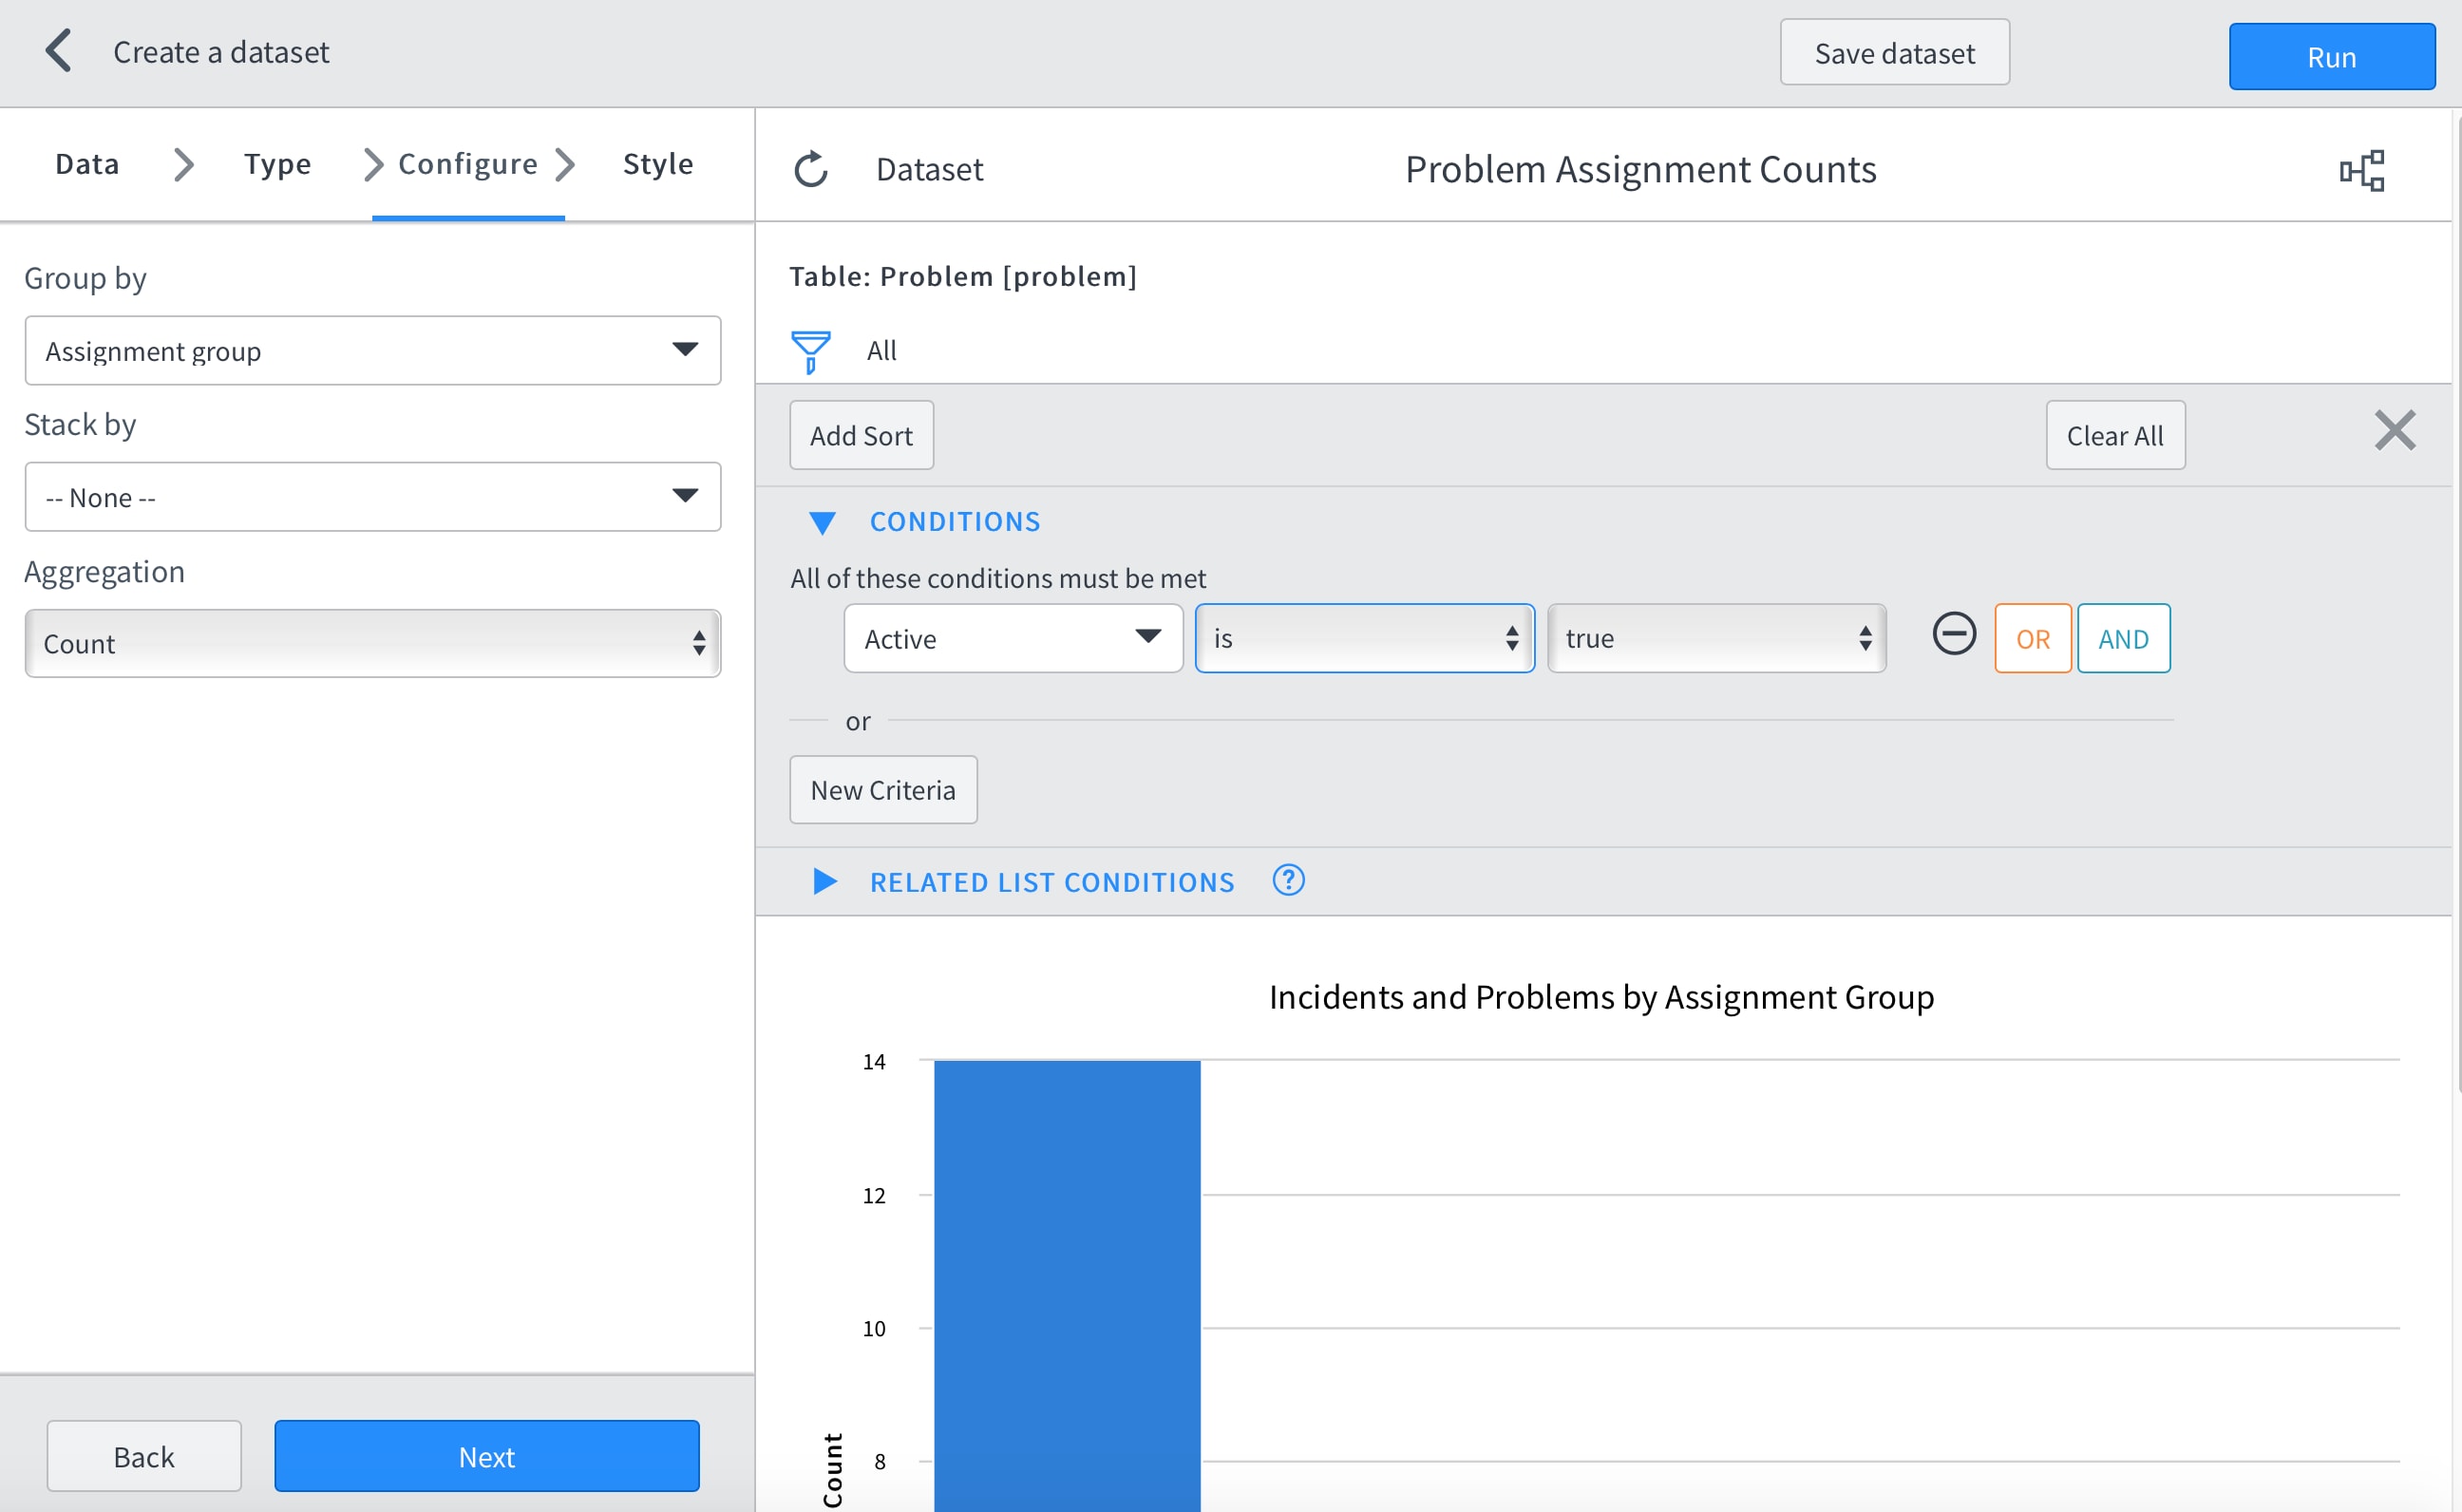
6. The Configure tab of the new Dataset record should appear. Select the appropriate Group by value for this report.
7. Click the Next button to advance to the Style tab, in which options can be configured regarding the color and data labels on this secondary data-set.
8. Once satisfied with all the changes, click the Save dataset button.
You have now created a multi-dataset report! Additional datasets (up to a maximum of 5) can be added to this same report.
--
Bonus! For 5 more tips on creating reports from multiple datasets check out Create Reports based on Multiple Datasets - Report Designer Interface.
Labels:
- 31,936 Views
6 Comments
You must be a registered user to add a comment. If you've already registered, sign in. Otherwise, register and sign in.
