- Post History
- Subscribe to RSS Feed
- Mark as New
- Mark as Read
- Bookmark
- Subscribe
- Printer Friendly Page
- Report Inappropriate Content
on 07-20-2017 02:52 AM
During some recent testing of pre-configured reports on my personal development instance.
The following "What You See Is Not Exactly What You Get" effect was seen.
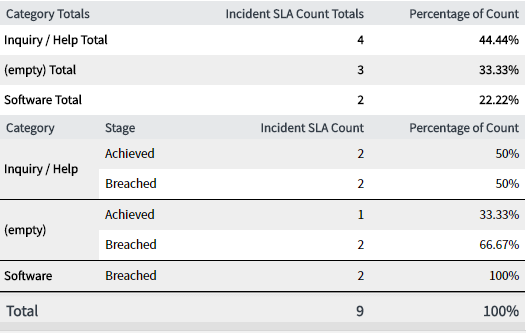
The pre-configued report being investigated was the "KPI - Incident Resolution within SLA by Category" on Jakarta.
The viewed reports show nice stacked bar chart with excellent supporting table as shown directly below.


The exported to PDF output contains a non.stacked bar chart with corresponding table unfortunately not the same viewed in the service now content frame. (see screenshot below and attached PDF file).

One conclusion is that the export to PDF function is based on "What You See Is What You Get" principle.
For my specific requirements this could become difficult issue.
It will become difficult create required reporting packages and sharing them externally through PDF in our currently defined ITIL service level management process when such unpredictable behavior happens.
- Mark as Read
- Mark as New
- Bookmark
- Permalink
- Report Inappropriate Content
Did additional testing with the following "Knowledge Created By Author" pre-configured report.
The table under the chart is created when the show data table is checked.
However when the viewed report is export the added data table is NOT included in the PDF output.
Based further community searches two helpful discsusion where found.
- https://community.servicenow.com/message/742070#742070
- https://community.servicenow.com/message/710455#710455
The second item refers to entry in the Service Now Wiki site which contains as useful table related to repoort outputs.

http://wiki.servicenow.com/index.php?title=Reporting#gsc.tab=0