- Mark as New
- Bookmark
- Subscribe
- Mute
- Subscribe to RSS Feed
- Permalink
- Report Inappropriate Content
11-22-2017 01:49 PM
I have a request for a report of how many tickets assigned to a assignment group at a given Monday and then the figure as at a given Friday.
How would I approach this historic point of time? As at Monday morning the XX assignment group had tickets assigned.
I am not able to see if filters can point back in time, can you please show how I could best approach this?
Number of incidents in Group A queue at beginning of week
Number of requests in Group A queue at beginning of week
Number of request in Group B queue at beginning of week
Number of incidents in Group A queue at end of week
Number of requests in Group A queue at end of week
Number of request in Group B queue at end of week
Number of tickets closed in each queue for the week
Solved! Go to Solution.
- Labels:
-
Dashboard
-
Performance Analytics
-
Reporting
- Mark as New
- Bookmark
- Subscribe
- Mute
- Subscribe to RSS Feed
- Permalink
- Report Inappropriate Content
11-22-2017 02:20 PM
Hi Phil,
Unfortunately, this kind of report is simply not possible without the use of Performance Analytics. The whole concept of PA is that it periodically snapshots certain information in a table (like, the count of Incidents assigned to a particular group), and saves that information separately. Then, when you want to report on that, you can chart the trend of how many tickets the group had at any moment over time.
If your company has PA Premium purchased, then you can pretty easily build an indicator that tracks this, or it could be included by default (we don't have it, so I can't check). All ServiceNow instances have a basic version of PA for Incident Management that tracks some data - take a look at yours and see if it's tracking this.
Incident Perf. Analytics: https://docs.servicenow.com/bundle/istanbul-performance-analytics-and-reporting/page/use/performance...
- Mark as New
- Bookmark
- Subscribe
- Mute
- Subscribe to RSS Feed
- Permalink
- Report Inappropriate Content
11-23-2017 02:56 AM
Hi Phil,
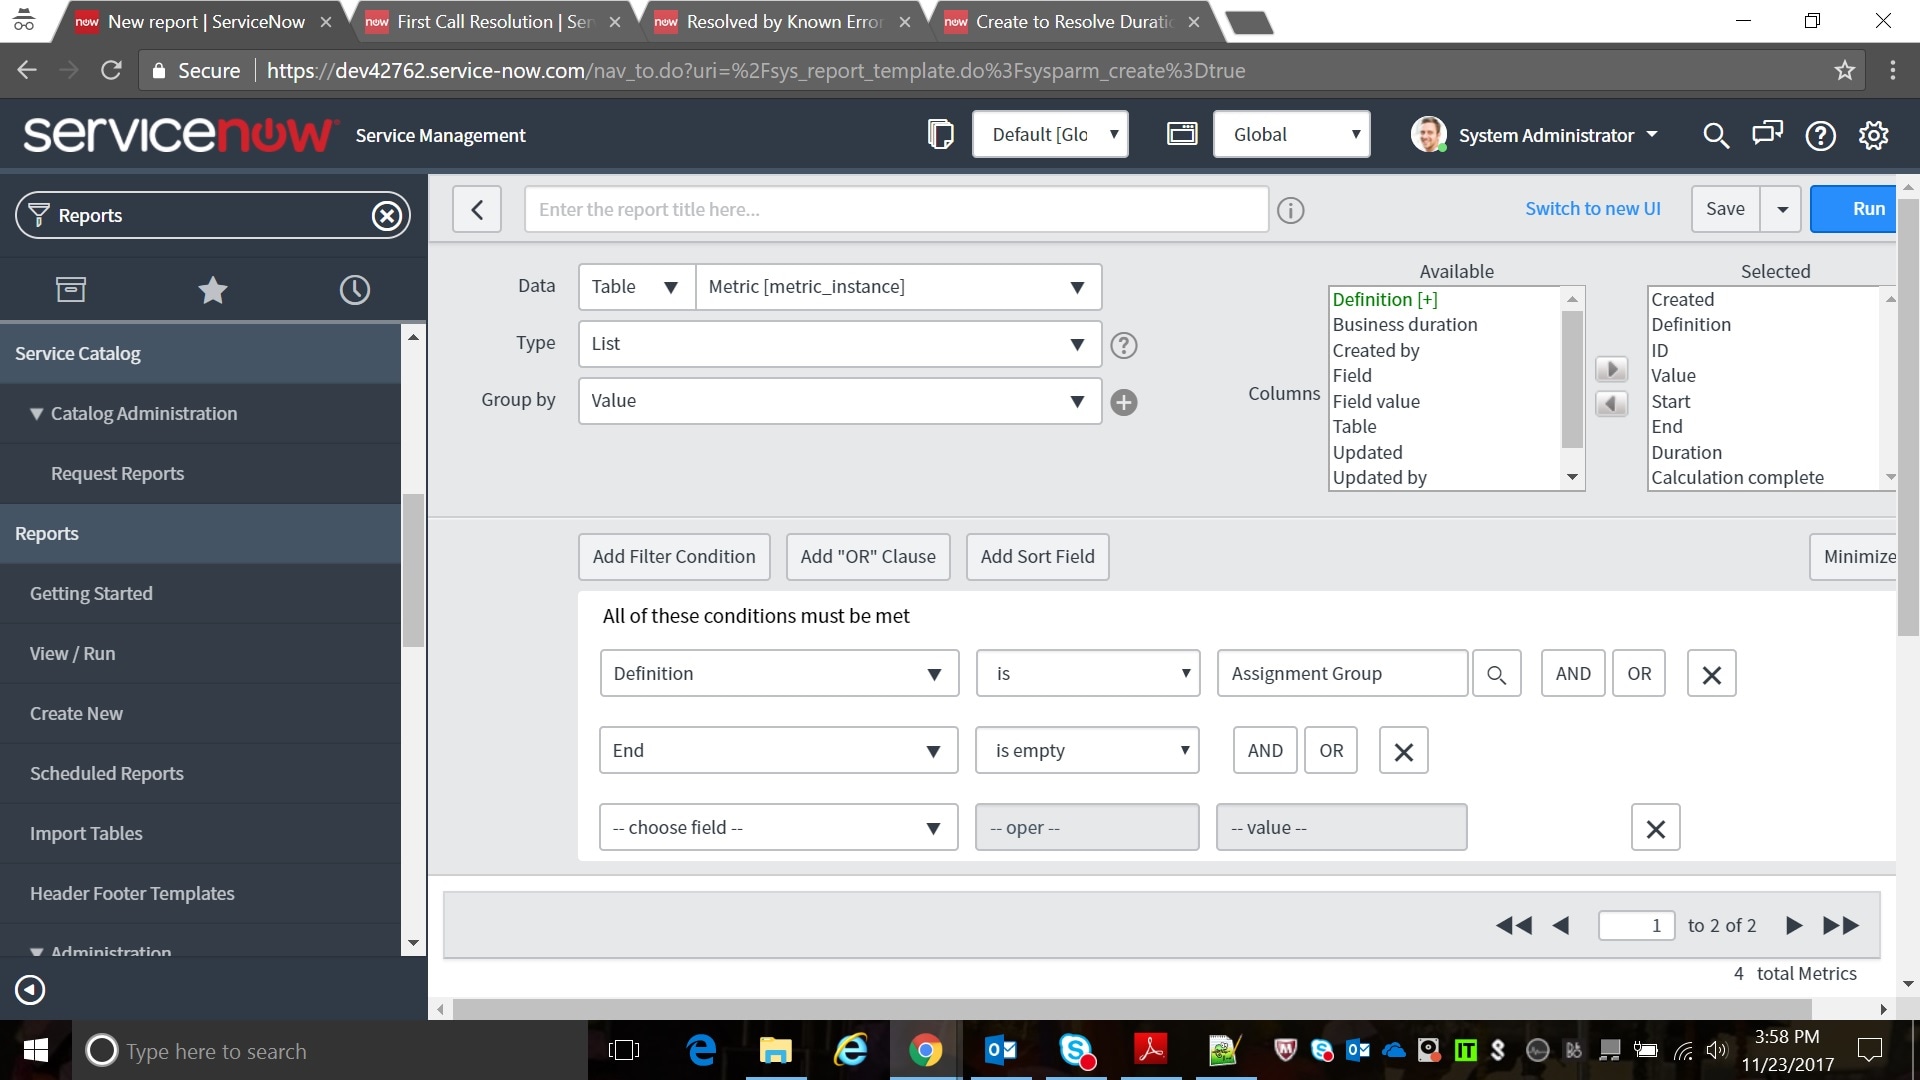
You can make use of metrics concept to get this data. ServiceNow provides an OOB metric named "Assignment Group". This metric captures the start time and end time when an incident is assigned to a particular group. So I believe you can build a report with filter information(provided below) and schedule it on Monday and Fridays.
Report can be created by following the below screenshot.


Only drawback being it will also include the resolved/closed incidents. However if you access to creating a new metric, then it can be created in such a way that you can get rid of this drawback
- Mark as New
- Bookmark
- Subscribe
- Mute
- Subscribe to RSS Feed
- Permalink
- Report Inappropriate Content
10-03-2024 03:00 PM
Hi Varads,
This was very helpful, have a question for you.
With regards to Start and End, what is the main difference with regards to assignment groups? For example, if I want to know how many incidents hit an assignment group on a day, regardless of when it was opened/closed, could I use Start > On > Date on the assignment group definition? Do i need to specify any values?