Combining multiple reports into a single one for a dashboard
- Mark as New
- Bookmark
- Subscribe
- Mute
- Subscribe to RSS Feed
- Permalink
- Report Inappropriate Content
02-25-2019 05:11 PM
Hey everyone,
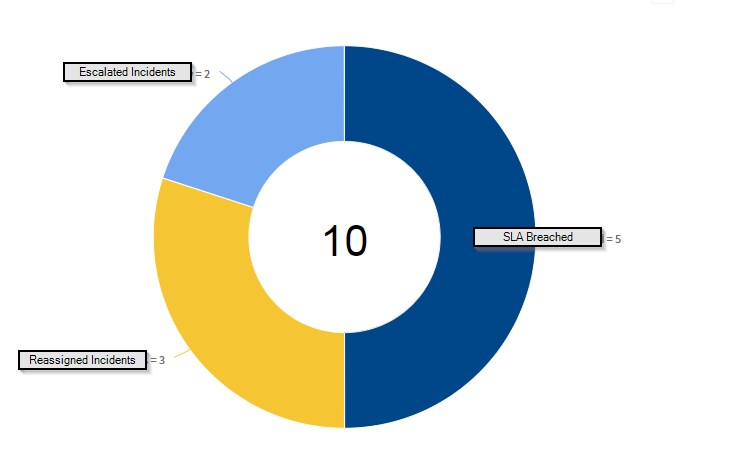
I am struggling with is (what I assume) a simple issue. I would like to create a report that visually combines the results of three other reports. For instance - I would like this report to show escalated incidents, breached SLAs, and reassignments. I have setup the conditions for each of these reports to show what I need but I cannot figure out how to group them to show in a single report that I can use to drill down into each category. I'm not looking to do anything fancy and am using OOTB reporting tools. I am still very new to how reporting works with ServiceNow, but I have not found much related to what I am trying to accomplish here or anywhere else. In essence, here is what I would like to accomplish:

- Mark as New
- Bookmark
- Subscribe
- Mute
- Subscribe to RSS Feed
- Permalink
- Report Inappropriate Content
11-19-2024 04:28 AM
I have multiple reports with simple queries in them showing the results in pie charts. I would like to take the results and combine them into one report using a pie chart.
- Mark as New
- Bookmark
- Subscribe
- Mute
- Subscribe to RSS Feed
- Permalink
- Report Inappropriate Content
02-28-2019 02:03 AM
Hi Dan,
did this help you out? If so, please mark my reply as Helpful or Correct.
cheers /Tommy
- Mark as New
- Bookmark
- Subscribe
- Mute
- Subscribe to RSS Feed
- Permalink
- Report Inappropriate Content
05-16-2023 11:06 AM
Hi Tommy,
This dataset option is not available for pie charts.
How to achieve the functionality to combine the pie charts in single.
- Mark as New
- Bookmark
- Subscribe
- Mute
- Subscribe to RSS Feed
- Permalink
- Report Inappropriate Content
05-16-2023 02:27 PM
you can use Or statement for your filter and do the group by on the active indicator (assuming you are only reporting on incidents that are no longer active) and that will give you the total number
- Mark as New
- Bookmark
- Subscribe
- Mute
- Subscribe to RSS Feed
- Permalink
- Report Inappropriate Content
05-20-2024 02:37 PM
Hi Tommy. Thanks for the advice, however when clicking the button 

This is a simple list view type of report. I'm hoping I can combine multiple list view reports into one report.
I am not an admin - is there a special request I can make to the administrators to enable this functionality for me?
Thanks!