Double Line Graph
- Mark as New
- Bookmark
- Subscribe
- Mute
- Subscribe to RSS Feed
- Permalink
- Report Inappropriate Content
07-05-2017 06:48 PM
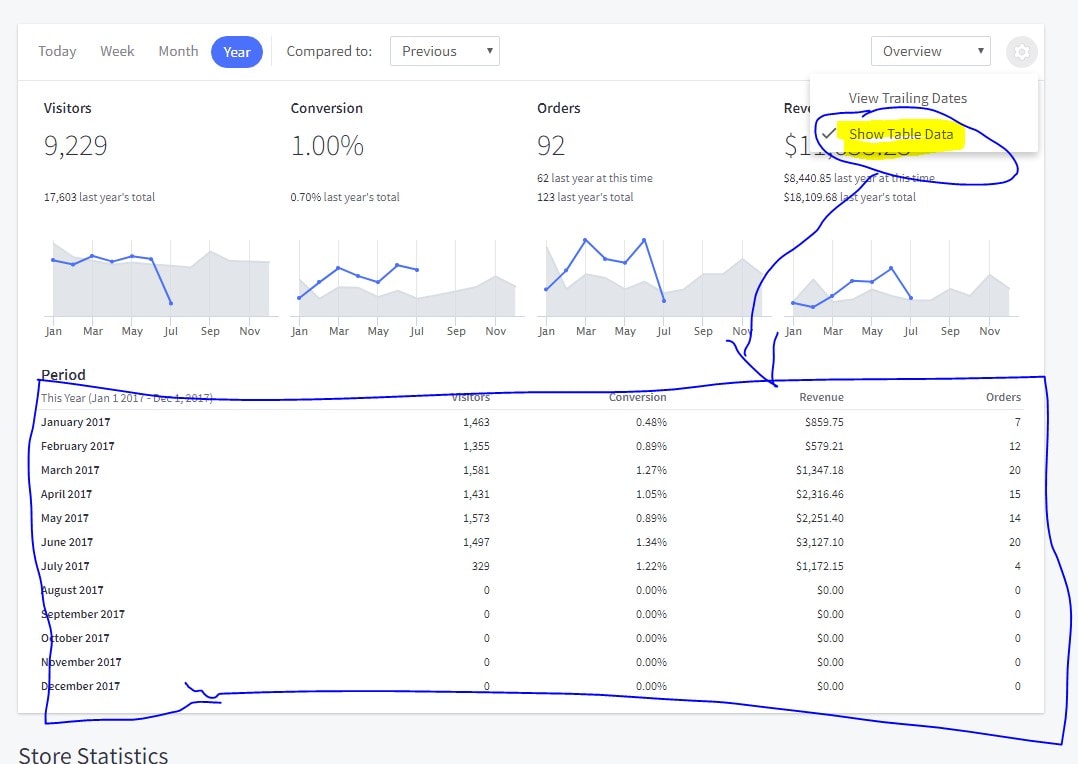
We have one table storing original target and total request submitted. I need to show both on same graph on Performance Analytics dashboard and then on Service Portal.
Currently graph is designed using double Line graph in excel and we have to replicate same in ServiceNow. Could you please tell me how we can do so?
Below is the pic:-

Regards
Sheetal
- Labels:
-
Dashboard
-
Performance Analytics
-
Reporting
- Mark as New
- Bookmark
- Subscribe
- Mute
- Subscribe to RSS Feed
- Permalink
- Report Inappropriate Content
07-05-2017 06:53 PM
Add a multiple dataset in your PA widget or report.
In a Performance Analytics widget, add an indicator using the Widget Indicators related list at the bottom of the widget form.
In a normal report, be sure to save your report first (or the Multiple Dataset option won't show up, this has given some of my teammates heartache...). Then click on the down arrow next to the Save button and select Multiple Dataset. You'll be able to add a second (or third or fourth or...) series to your chart.
Hope this helps,
--Dennis R
- Mark as New
- Bookmark
- Subscribe
- Mute
- Subscribe to RSS Feed
- Permalink
- Report Inappropriate Content
07-06-2017 09:26 PM


- Mark as New
- Bookmark
- Subscribe
- Mute
- Subscribe to RSS Feed
- Permalink
- Report Inappropriate Content
02-28-2023 04:31 PM
It is possible to get trend lines(even if you dont have perf analytics). All you have to do is use a dataset and you can add multiple trend lines to the same report.
Note: you will need to create a dataset per report.

Final Report:

here is a video by Goran which explains the process of adding a dataset and multiple trends in a report. You can start from the 8 min marker:
https://youtu.be/SQACTGJJoTE?t=495
Please let me know if you have any questions. Mark this helpful if found this helpful so that others can also find it as well.
