- Mark as New
- Bookmark
- Subscribe
- Mute
- Subscribe to RSS Feed
- Permalink
- Report Inappropriate Content
11-28-2018 12:44 PM
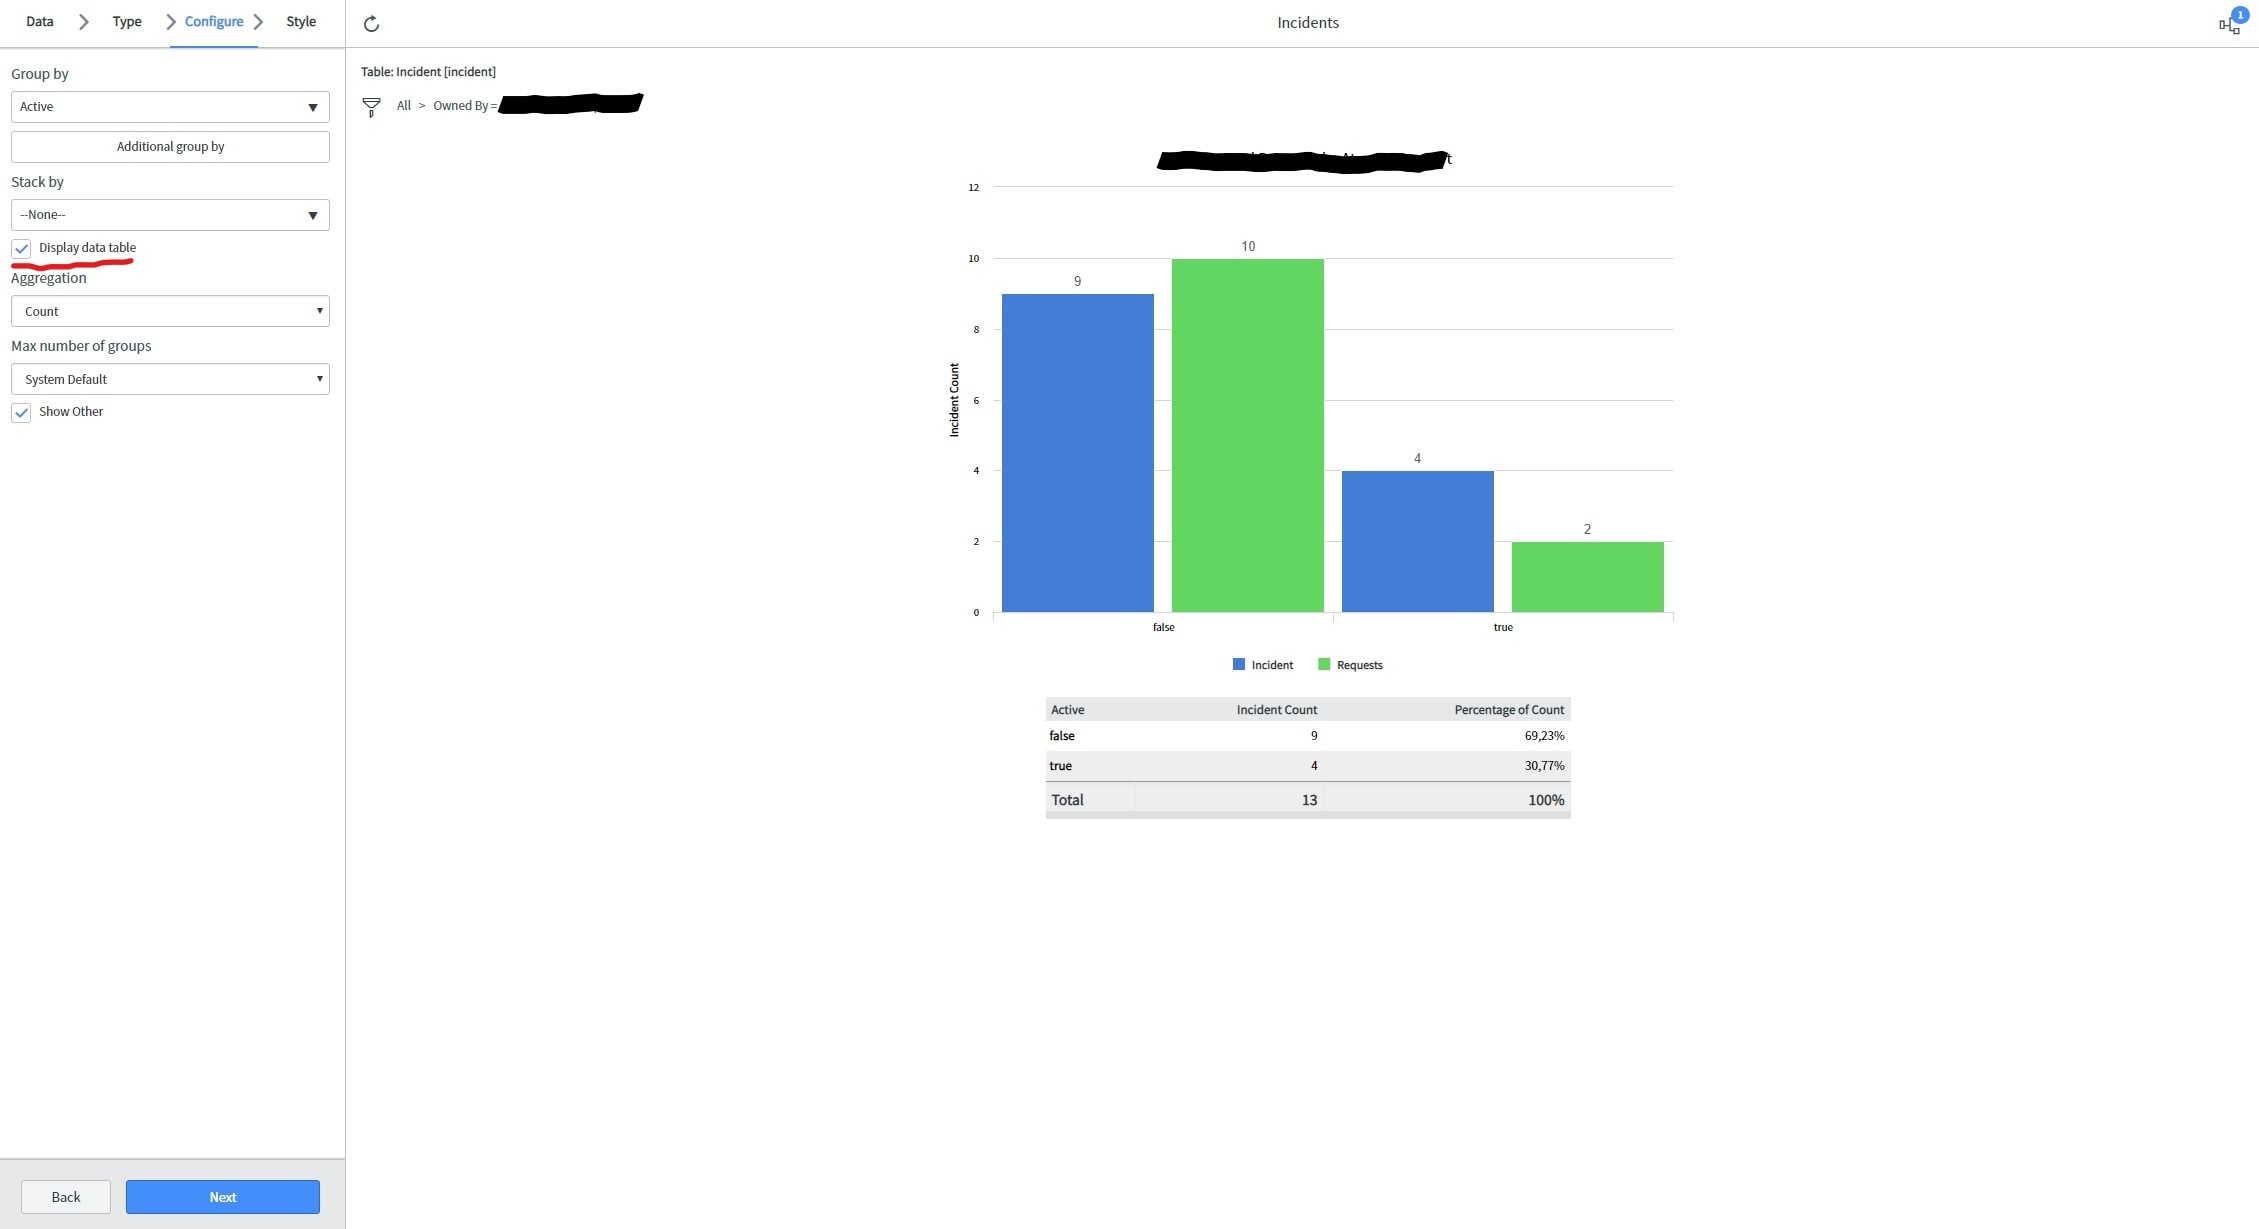
I have made a Incident Report with a second dataset to Request.
What do I need to do to display Requests count on my data table? I can't seem to find any option to add Display Data Table in my Request dataset as I do for Incident. And how would I add a drill down to my Request dataset? Is that even possible? Right now I only have one for Incidents.

In the end I just want to be able to show 2 bars per table (4 in total): Open records (new, work in progress etc) and Resolved (resolved, closed etc) and use a drill-down to show bars per state.
Solved! Go to Solution.
- Labels:
-
Reporting
- Mark as New
- Bookmark
- Subscribe
- Mute
- Subscribe to RSS Feed
- Permalink
- Report Inappropriate Content
11-29-2018 12:41 AM
- Mark as New
- Bookmark
- Subscribe
- Mute
- Subscribe to RSS Feed
- Permalink
- Report Inappropriate Content
11-29-2018 12:41 AM
You can display data table and drilldown only to main report.
- Mark as New
- Bookmark
- Subscribe
- Mute
- Subscribe to RSS Feed
- Permalink
- Report Inappropriate Content
11-29-2018 01:36 AM
It seems so. I've skipped the 2nd dataset and made a report based on the Task table instead and grouped by Task Type.
I find it weird that they've not added that functionality to the added datasets. There must be more cases where you would like that functionality. Maybe I'm just understanding the purpose of added datasets wrong.