I would like to create a dashboard report showing counts of incidents, tasks and requests in one bar graph, and when a column is selected drill down into data specific from that table.
- Mark as New
- Bookmark
- Subscribe
- Mute
- Subscribe to RSS Feed
- Permalink
- Report Inappropriate Content
11-09-2017 01:28 PM
I would like to create a dashboard report showing counts of incidents, tasks and requests in one bar graph, and when a column is selected drill down into data specific from that table. I was able to do this using data sets, but its displaying the data oddly with extra empty bars. I'd like to get rid of the extra empty bars. Any suggestions? See screenshot below...

I was able to get the graph to look the way I want to by just using the task table, with no data sets. However, then when you drill down on the data you get the task fields which aren't relevant for all 3 task types. For example, in incidents I want to see the caller, but for requests I want to see the Requested for field instead.
- Mark as New
- Bookmark
- Subscribe
- Mute
- Subscribe to RSS Feed
- Permalink
- Report Inappropriate Content
11-09-2017 01:35 PM
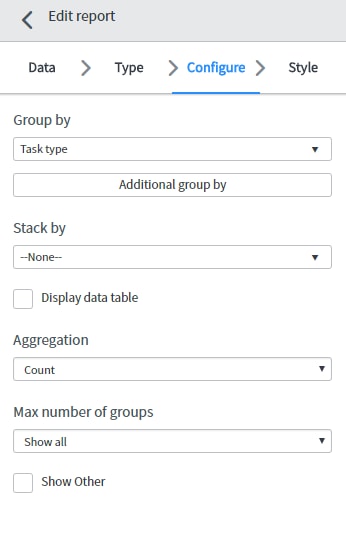
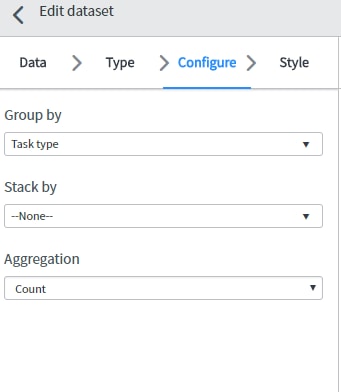
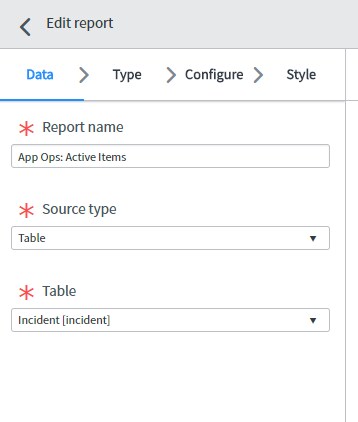
Can you show us your report configuration?
- Mark as New
- Bookmark
- Subscribe
- Mute
- Subscribe to RSS Feed
- Permalink
- Report Inappropriate Content
11-09-2017 01:43 PM


- Mark as New
- Bookmark
- Subscribe
- Mute
- Subscribe to RSS Feed
- Permalink
- Report Inappropriate Content
11-09-2017 08:05 PM
Prateek is correct you need to run the report off the task table.
- Mark as New
- Bookmark
- Subscribe
- Mute
- Subscribe to RSS Feed
- Permalink
- Report Inappropriate Content
11-09-2017 07:28 PM
