- Mark as New
- Bookmark
- Subscribe
- Mute
- Subscribe to RSS Feed
- Permalink
- Report Inappropriate Content
05-04-2018 11:28 PM
Hi Team,
I have a below requirement in which i need to show the report in the following format.
I need to show the incident count for last year month vs this year month as below. Please let me know what i need to do to achieve this.

Thanks in Advance!!
Regards,
Suresh
Solved! Go to Solution.
- Labels:
-
Dashboard
-
Performance Analytics
-
Reporting
- Mark as New
- Bookmark
- Subscribe
- Mute
- Subscribe to RSS Feed
- Permalink
- Report Inappropriate Content
05-05-2018 09:22 AM
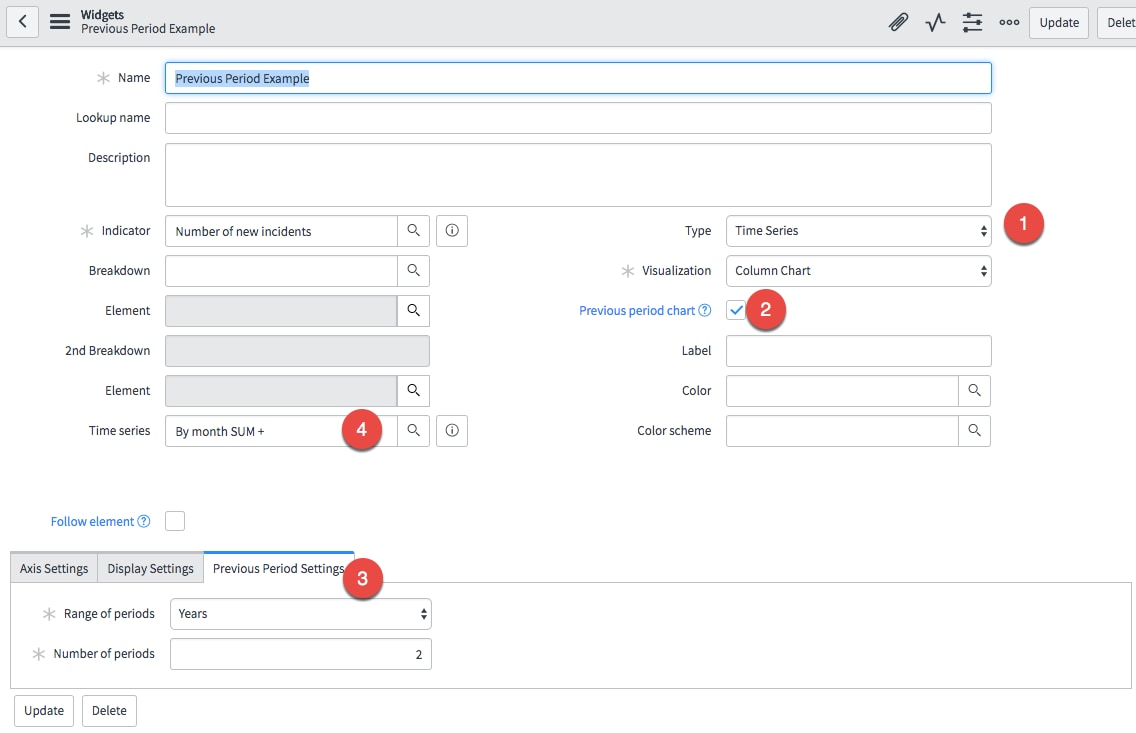
I believe you want a time series with a previous period option.
1) Select time series on the widget
2) Check "Previous period chart"
3) Select the range and number of periods
4) Set the time series if applicable (in this case, I have a daily indicator but I want to show the month comparison year over year)

- Mark as New
- Bookmark
- Subscribe
- Mute
- Subscribe to RSS Feed
- Permalink
- Report Inappropriate Content
05-04-2018 11:47 PM
- Mark as New
- Bookmark
- Subscribe
- Mute
- Subscribe to RSS Feed
- Permalink
- Report Inappropriate Content
05-05-2018 12:14 AM
Hi ,
Thanks for the reply!!
I have seen this link and my requirement is different ,client wants the incident data to be shown side by side for each month like below:
Mar 2017 Mar 2018 Apr 2017 Apr 2018 May 2017 May 2018
Thanks,
Suresh
- Mark as New
- Bookmark
- Subscribe
- Mute
- Subscribe to RSS Feed
- Permalink
- Report Inappropriate Content
05-05-2018 09:22 AM
I believe you want a time series with a previous period option.
1) Select time series on the widget
2) Check "Previous period chart"
3) Select the range and number of periods
4) Set the time series if applicable (in this case, I have a daily indicator but I want to show the month comparison year over year)
- Mark as New
- Bookmark
- Subscribe
- Mute
- Subscribe to RSS Feed
- Permalink
- Report Inappropriate Content
05-31-2022 12:49 PM
The solution describer by Adam worked perfectly well for me.
Does anyone know if I can configure a one-click behavior to alternate the Time Series from Monthly (this is an Indicator I designed for Monthly validity) to Quarterly.
Right now, the only way to change the time lime is to click and go to the Analytics hub and select it there but, some of my report consumers are not that PA savvy.
Thanks in advance