- Mark as New
- Bookmark
- Subscribe
- Mute
- Subscribe to RSS Feed
- Permalink
- Report Inappropriate Content
05-04-2018 11:28 PM
Hi Team,
I have a below requirement in which i need to show the report in the following format.
I need to show the incident count for last year month vs this year month as below. Please let me know what i need to do to achieve this.

Thanks in Advance!!
Regards,
Suresh
Solved! Go to Solution.
- Labels:
-
Dashboard
-
Performance Analytics
-
Reporting
- Mark as New
- Bookmark
- Subscribe
- Mute
- Subscribe to RSS Feed
- Permalink
- Report Inappropriate Content
05-05-2018 09:22 AM
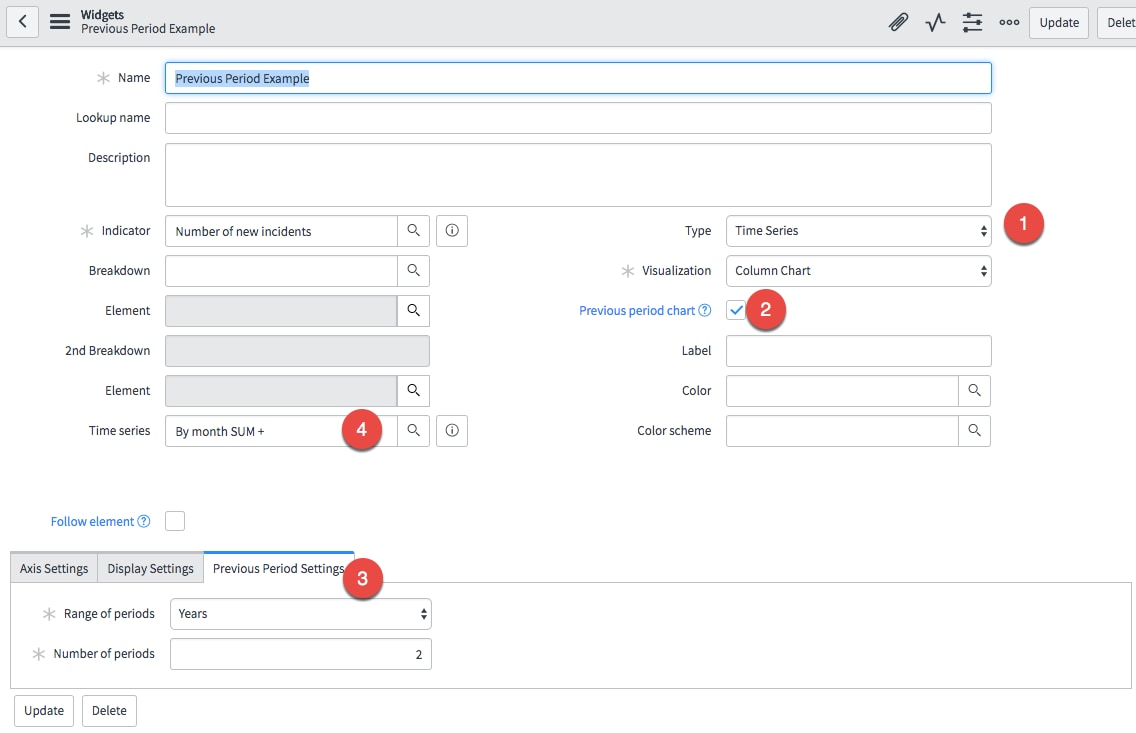
I believe you want a time series with a previous period option.
1) Select time series on the widget
2) Check "Previous period chart"
3) Select the range and number of periods
4) Set the time series if applicable (in this case, I have a daily indicator but I want to show the month comparison year over year)

- Mark as New
- Bookmark
- Subscribe
- Mute
- Subscribe to RSS Feed
- Permalink
- Report Inappropriate Content
05-07-2018 07:05 PM


- Mark as New
- Bookmark
- Subscribe
- Mute
- Subscribe to RSS Feed
- Permalink
- Report Inappropriate Content
05-07-2018 07:21 PM
Everything looks good going forward but not for historical data. You need (or may have) a historic collection for this indicator. If you run this, it will overwrite the existing data so I would define it to start where your data stops (sometime between January and February of this year). If this was all recently collected, you can collect up through yesterday.
Define a job that collects based on fixed (not relative dates) from 2016-01-01 through 2018-02-01. Run that and you should be all set.
- Mark as New
- Bookmark
- Subscribe
- Mute
- Subscribe to RSS Feed
- Permalink
- Report Inappropriate Content
05-07-2018 08:11 PM
Hi,
Thanks for the help!!
Historical data is appearing fine when we click on detailed score card, but the graph doesn't show the required data i.e Last Year Month, This Year Month Side by side in the dashboard Like Below:

RightNow, it shows all the months over 2017 and 2018 but the data should show like above Last Yr Month, This Yr Month Side by side.
Thank You,
Suresh
- Mark as New
- Bookmark
- Subscribe
- Mute
- Subscribe to RSS Feed
- Permalink
- Report Inappropriate Content
05-08-2018 08:19 AM
In the detailed scorecard, you included a screenshot of above, you have "All" selected but it only shows data back to January 2018. Are you sure you have data? Can you show the chart that shows the data going back a year or two? Better yet, on the detailed scorecard use the time series by month sum + and show the scores. Let's confirm there are values greater than zero.
- Mark as New
- Bookmark
- Subscribe
- Mute
- Subscribe to RSS Feed
- Permalink
- Report Inappropriate Content
05-08-2018 11:16 PM

