- Mark as New
- Bookmark
- Subscribe
- Mute
- Subscribe to RSS Feed
- Permalink
- Report Inappropriate Content
05-04-2018 11:28 PM
Hi Team,
I have a below requirement in which i need to show the report in the following format.
I need to show the incident count for last year month vs this year month as below. Please let me know what i need to do to achieve this.

Thanks in Advance!!
Regards,
Suresh
Solved! Go to Solution.
- Labels:
-
Dashboard
-
Performance Analytics
-
Reporting
- Mark as New
- Bookmark
- Subscribe
- Mute
- Subscribe to RSS Feed
- Permalink
- Report Inappropriate Content
05-05-2018 09:22 AM
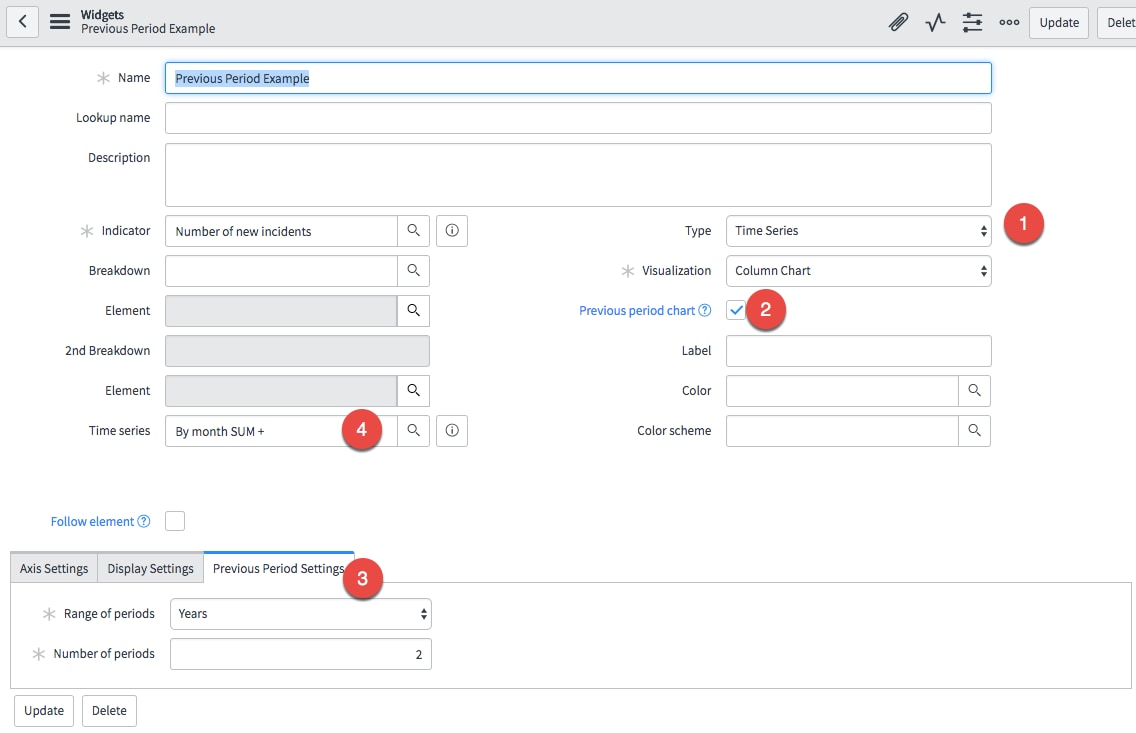
I believe you want a time series with a previous period option.
1) Select time series on the widget
2) Check "Previous period chart"
3) Select the range and number of periods
4) Set the time series if applicable (in this case, I have a daily indicator but I want to show the month comparison year over year)

- Mark as New
- Bookmark
- Subscribe
- Mute
- Subscribe to RSS Feed
- Permalink
- Report Inappropriate Content
05-05-2018 09:02 PM
Hi Adam,
Thanks for reply!!
I tried this approach but only could see the data populated for the current year(2018) and not populated for last year 2017.


I need to show the data for last year and current year with last year month , this year month side by side.
Example: Jan 2017 Jan 2018 Feb 2017 Feb 2018.....Dec 2017 Dec 2018
Regards,
Suresh
- Mark as New
- Bookmark
- Subscribe
- Mute
- Subscribe to RSS Feed
- Permalink
- Report Inappropriate Content
05-06-2018 08:39 AM
It should show all the data you have in your indicator, how far back have you collected data for your indicator? Do you see 2016 and 2017 data when you look at the detailed scorecard?
- Mark as New
- Bookmark
- Subscribe
- Mute
- Subscribe to RSS Feed
- Permalink
- Report Inappropriate Content
05-06-2018 06:56 PM


- Mark as New
- Bookmark
- Subscribe
- Mute
- Subscribe to RSS Feed
- Permalink
- Report Inappropriate Content
05-06-2018 11:28 PM
Hi,
It seems your historic data collection for 2017 is not happened, i would recommend to create a job and collect historic data from Jan1 2017 to dec 31 2017. Once data is collected then try to visualize the widget. It should show the comparison you are expecting.
- Mark as New
- Bookmark
- Subscribe
- Mute
- Subscribe to RSS Feed
- Permalink
- Report Inappropriate Content
05-07-2018 12:46 PM
It sounds like your indicator is not setup correctly. It should include only incidents created today (or this month) and then the job runs back 2 years. To verify this, please include a screenshot of your indicator source.