- Mark as New
- Bookmark
- Subscribe
- Mute
- Subscribe to RSS Feed
- Permalink
- Report Inappropriate Content
05-04-2018 11:28 PM
Hi Team,
I have a below requirement in which i need to show the report in the following format.
I need to show the incident count for last year month vs this year month as below. Please let me know what i need to do to achieve this.

Thanks in Advance!!
Regards,
Suresh
Solved! Go to Solution.
- Labels:
-
Dashboard
-
Performance Analytics
-
Reporting
- Mark as New
- Bookmark
- Subscribe
- Mute
- Subscribe to RSS Feed
- Permalink
- Report Inappropriate Content
05-05-2018 09:22 AM
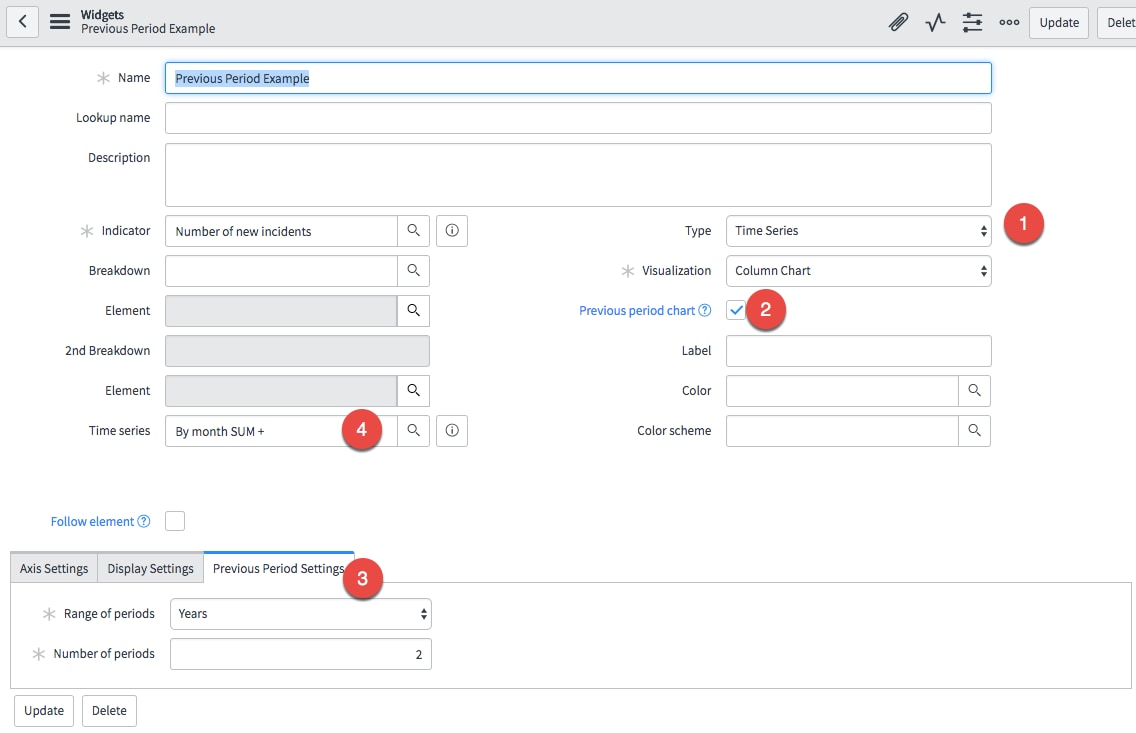
I believe you want a time series with a previous period option.
1) Select time series on the widget
2) Check "Previous period chart"
3) Select the range and number of periods
4) Set the time series if applicable (in this case, I have a daily indicator but I want to show the month comparison year over year)

- Mark as New
- Bookmark
- Subscribe
- Mute
- Subscribe to RSS Feed
- Permalink
- Report Inappropriate Content
05-07-2018 08:42 AM
You might try:
Create a filter to show only this year of data, with a trend of Opened (or Created) by Month
On the dropdown - select the option to add a Multiple DataSet, and do the same thing, but filter for Previous year. It looks like it COULD work, but I don't have enough data to be able to tell in my own instance.

- Mark as New
- Bookmark
- Subscribe
- Mute
- Subscribe to RSS Feed
- Permalink
- Report Inappropriate Content
05-07-2018 06:29 PM

- Mark as New
- Bookmark
- Subscribe
- Mute
- Subscribe to RSS Feed
- Permalink
- Report Inappropriate Content
07-01-2019 07:30 AM
It depends on the indicator you choose. To compare year o quarter, the indicator frequency, set by indicator source, must by monthly or quarterly, not daily o weekly. Number of new incident indicator is just daily (OOTB).