Percentage of incidents with breached SLA over time using only the reporting tool
- Mark as New
- Bookmark
- Subscribe
- Mute
- Subscribe to RSS Feed
- Permalink
- Report Inappropriate Content
10-06-2020 05:41 AM
Hi everyone,
Is there a possibility to generate a trend graph that shows the percentage of incidents with breached SLA over time using only the reporting tool, i.e. no PA? So, let's say I want to know what percentage of my active incidents had a breached SLA in each month of 2020.
Is it even possible to generate any averages over time periods in a trend report using only the reporting tool?
It just feels like such a basic reporting requirement that it should be part of a standard license. So I wonder if I am something missing and super grateful if anyone can help me out with this.
Thanks...
- Labels:
-
Performance Analytics
-
Reporting
- Mark as New
- Bookmark
- Subscribe
- Mute
- Subscribe to RSS Feed
- Permalink
- Report Inappropriate Content
10-06-2020 07:02 AM
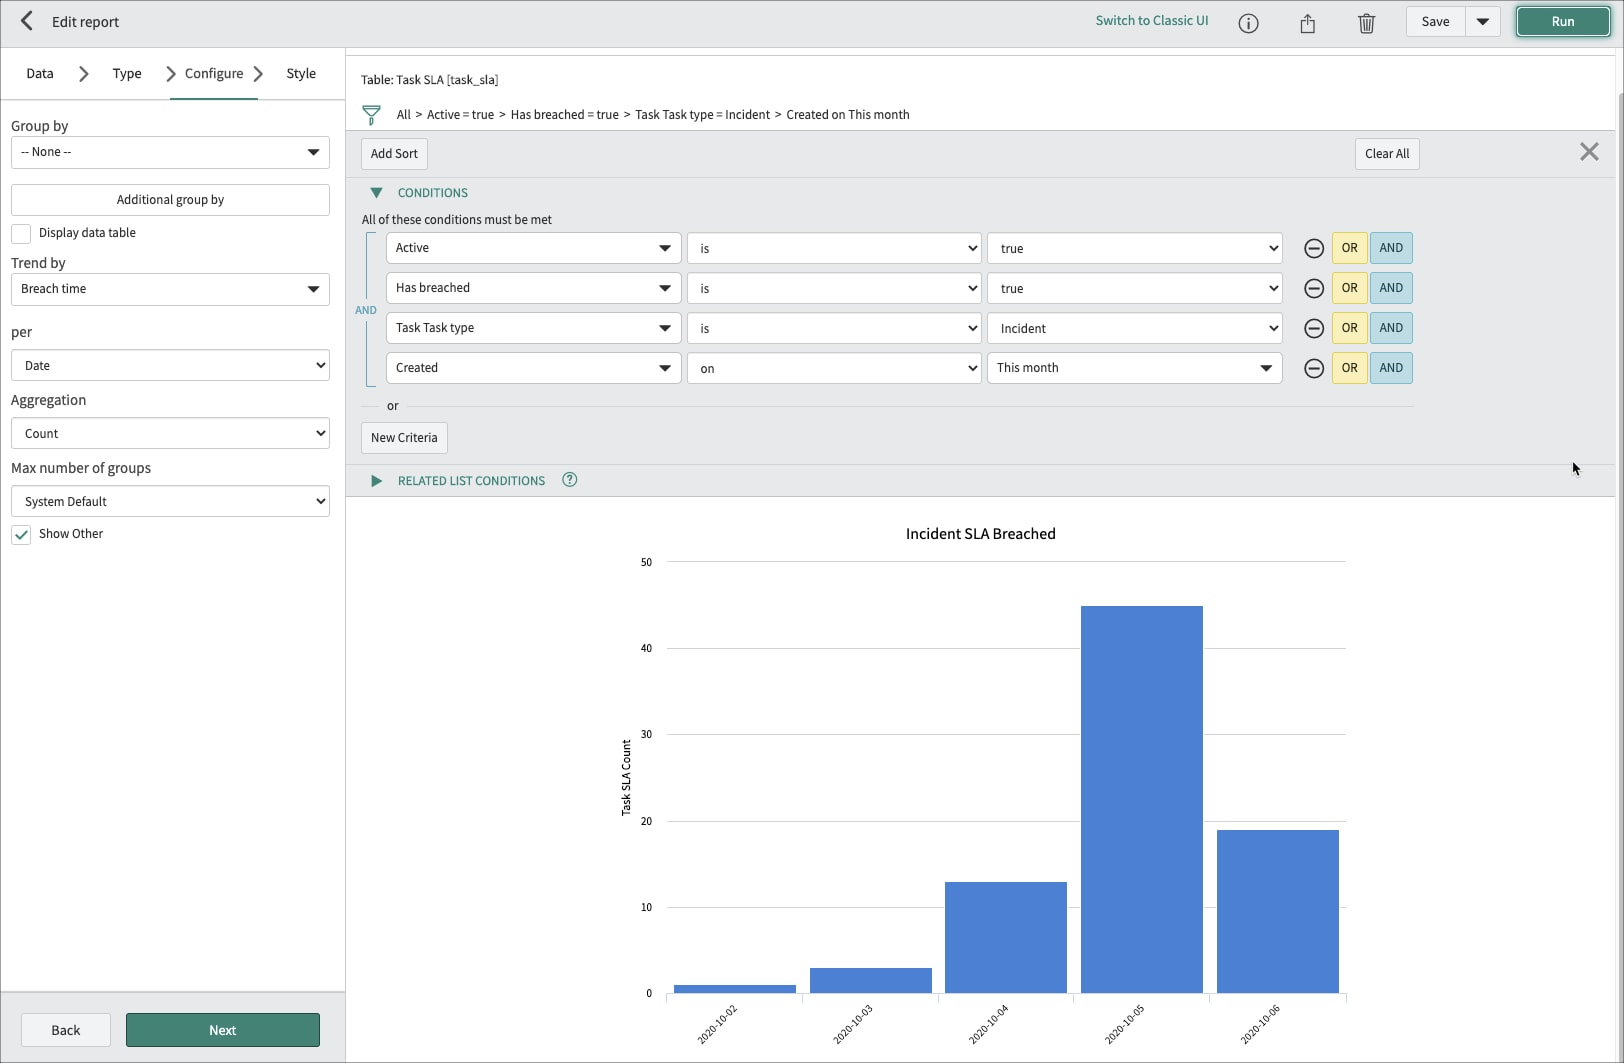
If you look at the Reports that come OOTB, you should see what that is called "Incident SLA Breached". This is a Single Score Report, but you could create a new one based off of that one, by doing an Insert and Stay. Then change it to a Trend report, trend it by Breached Time (or whatever other column you want to trend by). I have attached a screenshot that may help get you started.
Hope this helps,

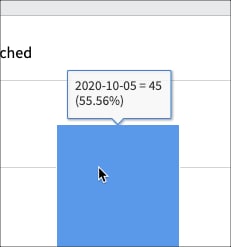
When you hover over a column, it will give you the % of that day of Incidents that Breached SLA:

- Mark as New
- Bookmark
- Subscribe
- Mute
- Subscribe to RSS Feed
- Permalink
- Report Inappropriate Content
10-06-2020 08:18 AM
Hi Thomas,
thanks so much, the created on filter was a revelation for me :-).
However, in this report, the percentages in the hover over are not referring to the share of incidents with breached SLA relative to the total number of incidents of that time period. They are referring to the share of the incidents with breached SLA of that time period relative to all incidents with breached SLA in the data (table). You can see that by looking at the data table for the report.
Is that the case for your report too?
What I'm looking for is the share of incidents of, let's say a week, with breached SLA relative to all active incidents of that week displayed over a year.

- Mark as New
- Bookmark
- Subscribe
- Mute
- Subscribe to RSS Feed
- Permalink
- Report Inappropriate Content
11-15-2021 01:46 PM
Is there any way to show the percentages without having to hover over the table? That's what my boss want, nothing else.