- Mark as New
- Bookmark
- Subscribe
- Mute
- Subscribe to RSS Feed
- Permalink
- Report Inappropriate Content
06-22-2016 01:47 AM
Morning all!
This is my first post here (of many to come, I'm sure ) and I'm just wondering if there's anyone with knowledge on an issue that is puzzling me and my team.
Within Geneva PA, we've started creating dashboards and have noticed that although you can set labels on Widget Indicators, it does not seem possible to label the primary indicator that you set in the Widget Configuration area, which is kind of screwing up the look of our Legends on graphs. I include an image below to show what I mean.

Any ideas on how we can get around this? The HTML suggests that there is no implemented way of labelling this, unless we can get around with some sort of formula coding? Ideally, we need a simple solution that can be done within the design GUI (don't know if SNOW can confirm if that's an improvement on the horizon or not?)
Any help appreciated
Solved! Go to Solution.
- Labels:
-
Performance Analytics
- Mark as New
- Bookmark
- Subscribe
- Mute
- Subscribe to RSS Feed
- Permalink
- Report Inappropriate Content
06-22-2016 02:37 AM
Hi Jason,
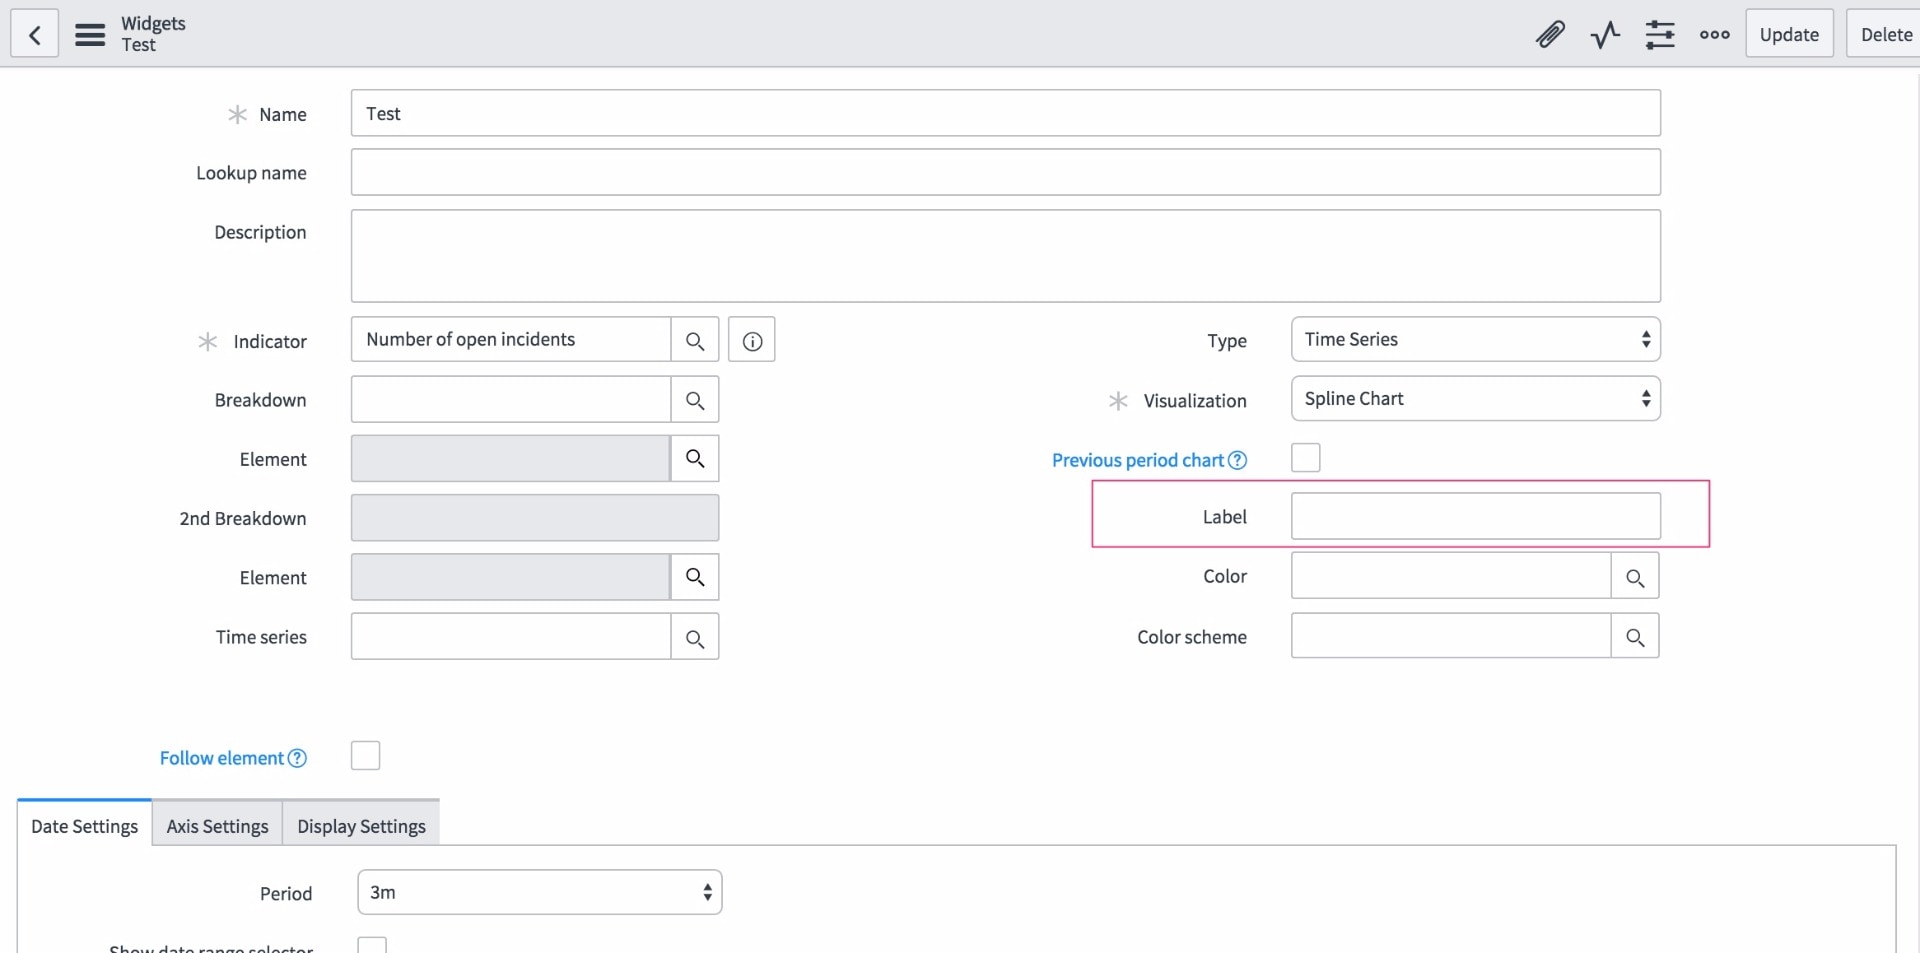
What version are you on? There is a 'label' field that sets the label of the primary indicator similar as in the additional indicators, see below. This is Helsinki but I believe it is also there in Geneva; not sure about prior to that.

Alternatively, as suggested have a look at widget of type 'breakdown' with visualisation 'column and total'.
Best regards,
Erik
- Mark as New
- Bookmark
- Subscribe
- Mute
- Subscribe to RSS Feed
- Permalink
- Report Inappropriate Content
06-22-2016 02:12 AM
Hi Jason,
I am not sure what kind of widget you're using. If a 'time series' widget with additional indicators then there is a field called 'label' in the primary configuration. Note that it is also possible to use a widget of type 'breakdown' with visualisation 'column and total' that will get you to a similar chart.
Bets regards,
Erik
- Mark as New
- Bookmark
- Subscribe
- Mute
- Subscribe to RSS Feed
- Permalink
- Report Inappropriate Content
06-22-2016 02:27 AM
Many thanks for the quick response Erik, but I think my original message has been mixed. I can see, and am using, the labels for 'additional indicators' - this creates the P0-P4 as required. Its the primary indicator as highlighted below, that creates the total trend, that needs to have a label option and I cannot find a way of doing this. As you can't create a widget without the primary indicator, and cannot hide it, it would be pointless of me to currently try and add the trend as an additional indicator from how I can see this working, unless I'm looking at this wrong?

- Mark as New
- Bookmark
- Subscribe
- Mute
- Subscribe to RSS Feed
- Permalink
- Report Inappropriate Content
06-22-2016 02:37 AM
Hi Jason,
What version are you on? There is a 'label' field that sets the label of the primary indicator similar as in the additional indicators, see below. This is Helsinki but I believe it is also there in Geneva; not sure about prior to that.
Alternatively, as suggested have a look at widget of type 'breakdown' with visualisation 'column and total'.
Best regards,
Erik
- Mark as New
- Bookmark
- Subscribe
- Mute
- Subscribe to RSS Feed
- Permalink
- Report Inappropriate Content
06-22-2016 02:46 AM
Top man! That's just got me thinking and following a quick check with the admin team, it was a hidden field after all that. Many thanks for the pointer.