Platform Analytics - Multiple breakdown value not showing data for KPI Details
- Mark as New
- Bookmark
- Subscribe
- Mute
- Subscribe to RSS Feed
- Permalink
- Report Inappropriate Content
08-27-2025 09:02 AM
Greetings Everyone,
I'm new to PA and facing an obstacle while working on a requirement. To be brief: I have an indicator that tracks, on a daily basis, the number of search events where results were returned but the user did not click on any of them. I created a breakdown called Market, which filters search events by the user’s market (since each search event is linked to the user who conducted the search).
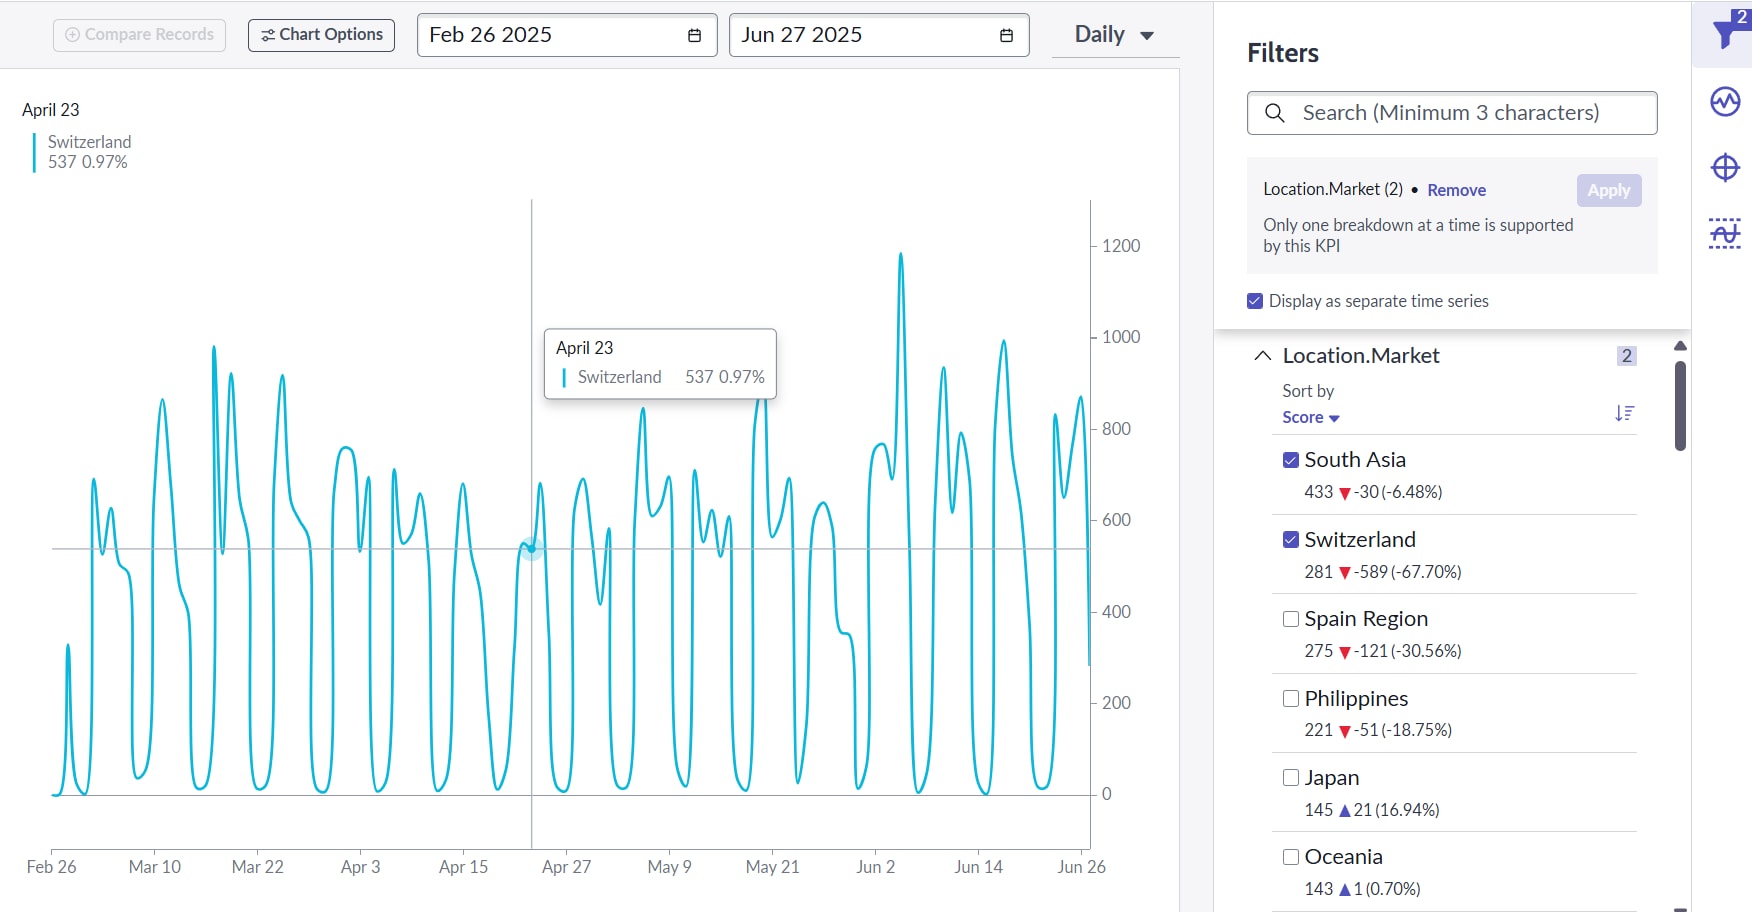
In the KPI Details of that indicator, under the filter section, I expanded the "Market" filter and started choosing values to filter. When I select two values (e.g., Switzerland and Germany), only Switzerland’s data is displayed. However, if I select just one of them individually, the data shows normally. This behavior occurs with almost all filter values. Some pairs did show all the data.
So I’d like to ask if anyone has any guess about this behavior. Could it be related to the data, the configuration, or is it an expected limitation/behavior of Platform Analytics breakdowns?
Thanks!
- Mark as New
- Bookmark
- Subscribe
- Mute
- Subscribe to RSS Feed
- Permalink
- Report Inappropriate Content
08-28-2025 07:40 AM
Can you check breakdown source and confirm you do not have any filter conditions that excludes certain countries because of match conditions.
If breakdown source is choice fields or reference fields, check and confirm created time for all locations are same and historical data you are trying to fetch in KPI exist for the combination. It would be worthwhile to run historical jobs once and try it again.

If this helped to answer your query, please mark it helpful & accept the solution.
Thanks,
Bhuvan
- Mark as New
- Bookmark
- Subscribe
- Mute
- Subscribe to RSS Feed
- Permalink
- Report Inappropriate Content
08-28-2025 09:36 AM
@Bhuvan
I believe that if a country is excluded from the breakdown source condition, its value will not appear in the filter options for me to choose.

I'm not sure if I understood your second point correctly, but all the locations were created before the data was generated, so I don’t think that’s the case.
Additionally, I noticed that when I change the time aggregation to something like “365 days running SUM/AVG”, the data starts to appear in the chart — but with less than 365 days, it doesn’t. With period aggregation, the data starts to show when I set it to “By month SUM/AVG.” The same goes for “to date” aggregation: the larger the range, the more likely the data will show.
So I’m afraid the cause might be the nature or current state of my dataset, and that the breakdown doesn’t match very well with it. I’m not sure if it would behave differently with a larger dataset.
About the combination: if choosing more than two elements to display data on the chart works the same as applying an OR filter with them in the source list view, then the data should be there, but it isn’t showing up. Please correct me if I’m wrong.
Thanks and Regards,
Khanh Nguyen
- Mark as New
- Bookmark
- Subscribe
- Mute
- Subscribe to RSS Feed
- Permalink
- Report Inappropriate Content
08-28-2025 10:44 PM
Did you get a chance to review this ?
If my response helped to answer your query, please mark it helpful & accept the solution.
Thanks,
Bhuvan
- Mark as New
- Bookmark
- Subscribe
- Mute
- Subscribe to RSS Feed
- Permalink
- Report Inappropriate Content
08-28-2025 11:39 PM
Hi @Bhuvan ,
It seems my reply needs approval from ServiceNow, so it gets delayed even though I replied not long after seeing your response. I’ve posted another question asking about this.
Sorry for the inconvenience.
Thanks and Regards,
Khanh Nguyen
- Mark as New
- Bookmark
- Subscribe
- Mute
- Subscribe to RSS Feed
- Permalink
- Report Inappropriate Content
08-27-2025 11:28 PM
Hi @Bhuvan
Thank you for the information. I’ll review it as soon as possible and let you know.
I posted this during my night time, so apologies for the late response.
Regards,
Khanh Nguyen