RAG Traffic Lights Visualization on Reports/Dashboards to view the Project Health
- Mark as New
- Bookmark
- Subscribe
- Mute
- Subscribe to RSS Feed
- Permalink
- Report Inappropriate Content
11-09-2020 03:56 AM
Hello,
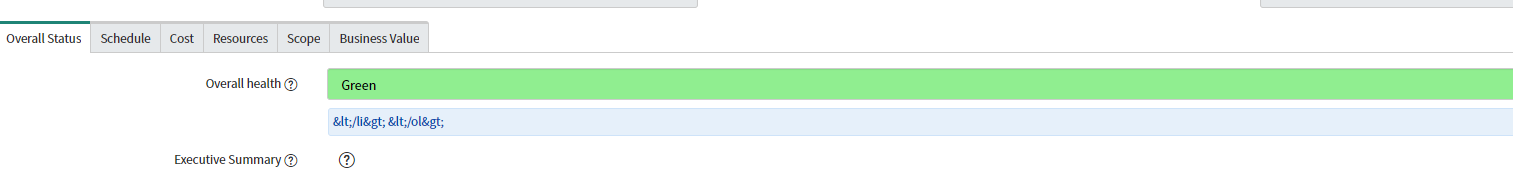
We have an OOB field on Status Report(project_status) table as Overall health ( overall_health)


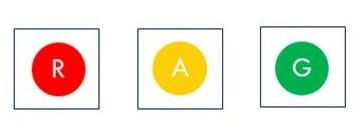
We would like to have a Traffic Light visualization to showcase the RAG status of the overall health of our Projects i.e Red/Amber/Green like below, can we achieve it ServiceNow, has someone done this already may be using Dynamic Contents?
So, if click on Red it takes to Projects with Red Overall health and similarly Green and Amber.

Thanks in Advance for support
- Labels:
-
Dashboard
-
Performance Analytics
-
Reporting
- Mark as New
- Bookmark
- Subscribe
- Mute
- Subscribe to RSS Feed
- Permalink
- Report Inappropriate Content
11-10-2020 06:26 AM
Hi
I assume you want the RAG Icons above on a dashboard somewhere. The approach would depend on how you expect clicking on the Icon to work, but both I would envisage can be done via Content Block.
1. Clicking on the Icon redirects to a filtered list:
This is simply an HTML block displaying the Icons and a Hyperlink behind each one to the filtered link i.e. to https://INSTANCE.service-now.com/nav_to.do?uri=%2Fproject_status_list.do%3Fsysparm_query%3Doverall_healthINgreen
2. Clicking on the Icon filters a list that is on the Dashboard:
This would involve a Custom Interactive Filter where clicking on the Icon runs the filter.
This example is good as it works as you want but with buttons: https://docs.servicenow.com/bundle/paris-performance-analytics-and-reporting/page/use/dashboards/reference/r_CustomPublisherExample.html
Alec
- Mark as New
- Bookmark
- Subscribe
- Mute
- Subscribe to RSS Feed
- Permalink
- Report Inappropriate Content
11-10-2020 10:42 PM
Thanks a Lot Alec, do you have sample code for option 1.