- Mark as New
- Bookmark
- Subscribe
- Mute
- Subscribe to RSS Feed
- Permalink
- Report Inappropriate Content
03-26-2018 04:27 PM
Good Day.
I was asked to do a report based on the SLA percentages, if the sla percentage time is less than 100% then its the green part, yellow just over 100%, and red way over 100%. Which meand yellow and red is breached, but they need to know how much over.

Solved! Go to Solution.
- Labels:
-
Reporting
- Mark as New
- Bookmark
- Subscribe
- Mute
- Subscribe to RSS Feed
- Permalink
- Report Inappropriate Content
03-27-2018 09:45 AM
Ah, good, I'm not going crazy. 🙂
So good news and bad news. The good news is that ServiceNow has a "semi donut" visualization that will probably get you in the neighborhood of what you want. The bad news is that ServiceNow doesn't do percentage calculations in a report, at least not easily.
Still, hopefully this will be good enough to work with. Probably the easiest way to implement something like this is to use report ranges. To do so, go to Reports > Administration > Report Ranges and create three new ranges, something like:
- <= 100% [color: #80ff80, upper val int = 100, order = 100]
- 100% - 150% [color: #ffff80, upper val int = 150, order = 200]
- > 150% [color: #ff8080, upper val int = 99999, order = 300]
These is the example ranges I created in my test instance:

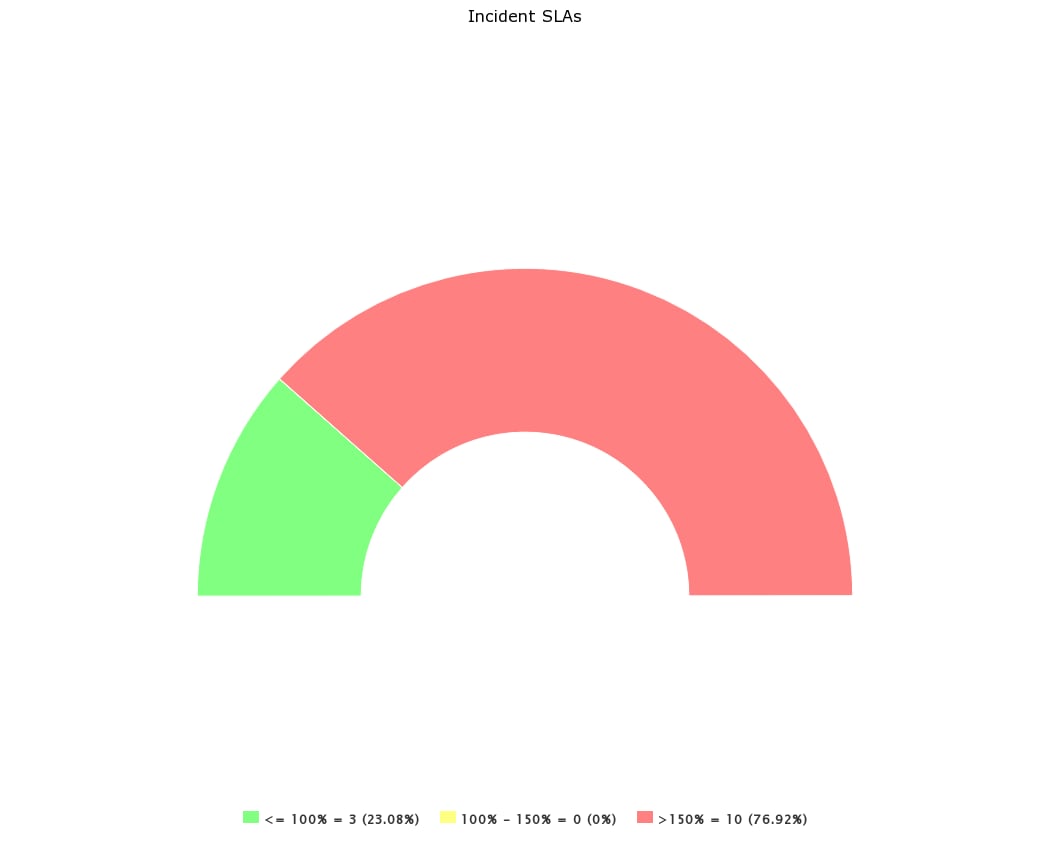
Now create a semi donut report against the incident_sla table and group by Business elapsed percentage, aggregating on count. When run, the report should look something like this:

Of course, feel free to tweak the ranges, colors, labels, or anything else to suit your needs.
If you want something more complicated, you'll probably have to fall back on performance analytics to create a formula indicator, but that would be a premium feature. If you have a PA license and want help in creating such an indicator, let me know.
Hope this helps,
--Dennis R
- Mark as New
- Bookmark
- Subscribe
- Mute
- Subscribe to RSS Feed
- Permalink
- Report Inappropriate Content
03-26-2018 06:58 PM
Okay, I'm feeling a bit dense right now. What kind of widget or visualization is that?
--Dennis R
- Mark as New
- Bookmark
- Subscribe
- Mute
- Subscribe to RSS Feed
- Permalink
- Report Inappropriate Content
03-27-2018 09:13 AM
Good day.
That's from another Help Desk application, the one we our migrating from. That's why the managers want to have something similar.
- Mark as New
- Bookmark
- Subscribe
- Mute
- Subscribe to RSS Feed
- Permalink
- Report Inappropriate Content
03-27-2018 09:45 AM
Ah, good, I'm not going crazy. 🙂
So good news and bad news. The good news is that ServiceNow has a "semi donut" visualization that will probably get you in the neighborhood of what you want. The bad news is that ServiceNow doesn't do percentage calculations in a report, at least not easily.
Still, hopefully this will be good enough to work with. Probably the easiest way to implement something like this is to use report ranges. To do so, go to Reports > Administration > Report Ranges and create three new ranges, something like:
- <= 100% [color: #80ff80, upper val int = 100, order = 100]
- 100% - 150% [color: #ffff80, upper val int = 150, order = 200]
- > 150% [color: #ff8080, upper val int = 99999, order = 300]
These is the example ranges I created in my test instance:
Now create a semi donut report against the incident_sla table and group by Business elapsed percentage, aggregating on count. When run, the report should look something like this:
Of course, feel free to tweak the ranges, colors, labels, or anything else to suit your needs.
If you want something more complicated, you'll probably have to fall back on performance analytics to create a formula indicator, but that would be a premium feature. If you have a PA license and want help in creating such an indicator, let me know.
Hope this helps,
--Dennis R
- Mark as New
- Bookmark
- Subscribe
- Mute
- Subscribe to RSS Feed
- Permalink
- Report Inappropriate Content
12-10-2018 08:26 AM
Hello,
I too am trying to get percentages for our SLAs. We do have a PA license but not sure what I need to do to create a formula indicator.
Thanks for any help you can provide!
Monica