- Mark as New
- Bookmark
- Subscribe
- Mute
- Subscribe to RSS Feed
- Permalink
- Report Inappropriate Content
05-09-2018 10:02 AM
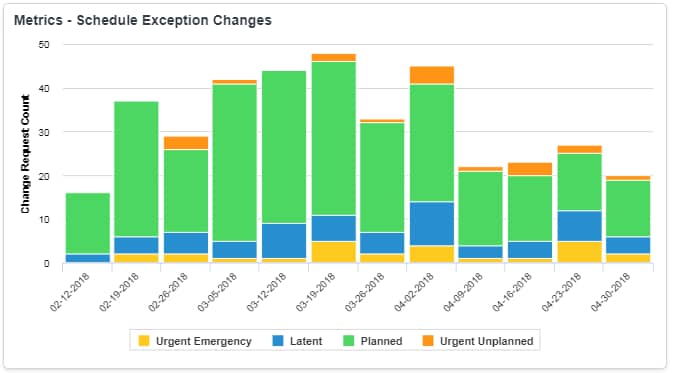
I'm trying create a stacked column report in PA. When I add the breakdown to the widget, it does not show on the graph. However, if I take that breakdown out of the widget and put it in the indicator, then I can view them breakdowns just fine. I have a report that we work off of, but I'd really like to utilize the trending with original view.
Report View (This is what I'm trying to recreate)

Widget with Breakdown

Widget without Breakdown

Breakdown working in the breakdown tab

Solved! Go to Solution.
- Labels:
-
Performance Analytics
- Mark as New
- Bookmark
- Subscribe
- Mute
- Subscribe to RSS Feed
- Permalink
- Report Inappropriate Content
05-09-2018 10:30 AM
I think you need to create 4 indicators for this. Have your primary indicator that shows one stack of the bar - then scroll to the bottom of the widget, there's an area to add additional indicators. You can set the order and color for each bar.
This enabled me to create the stacked bar chart.
Hope this helps.
- Mark as New
- Bookmark
- Subscribe
- Mute
- Subscribe to RSS Feed
- Permalink
- Report Inappropriate Content
05-09-2018 10:48 AM
Thanks. It's not ideal but I'll build it that way.
Here are two other threads that I've found since posting this.
https://community.servicenow.com/community?id=community_question&sys_id=88f807a1db5cdbc01dcaf3231f9619ce
https://community.servicenow.com/community?id=community_question&sys_id=ce2097e5dbdcdbc01dcaf3231f96196e
- Mark as New
- Bookmark
- Subscribe
- Mute
- Subscribe to RSS Feed
- Permalink
- Report Inappropriate Content
05-18-2018 02:06 AM