- Mark as New
- Bookmark
- Subscribe
- Mute
- Subscribe to RSS Feed
- Permalink
- Report Inappropriate Content
04-06-2021 07:05 AM
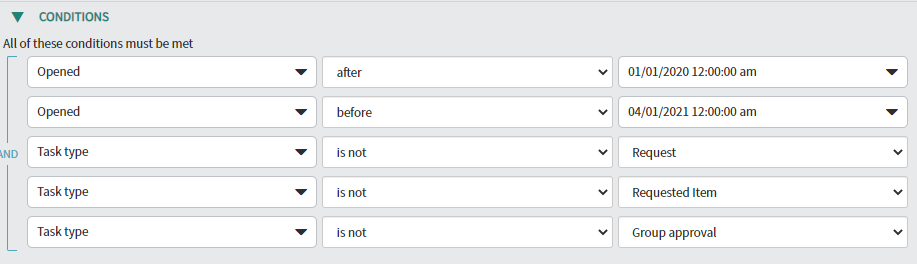
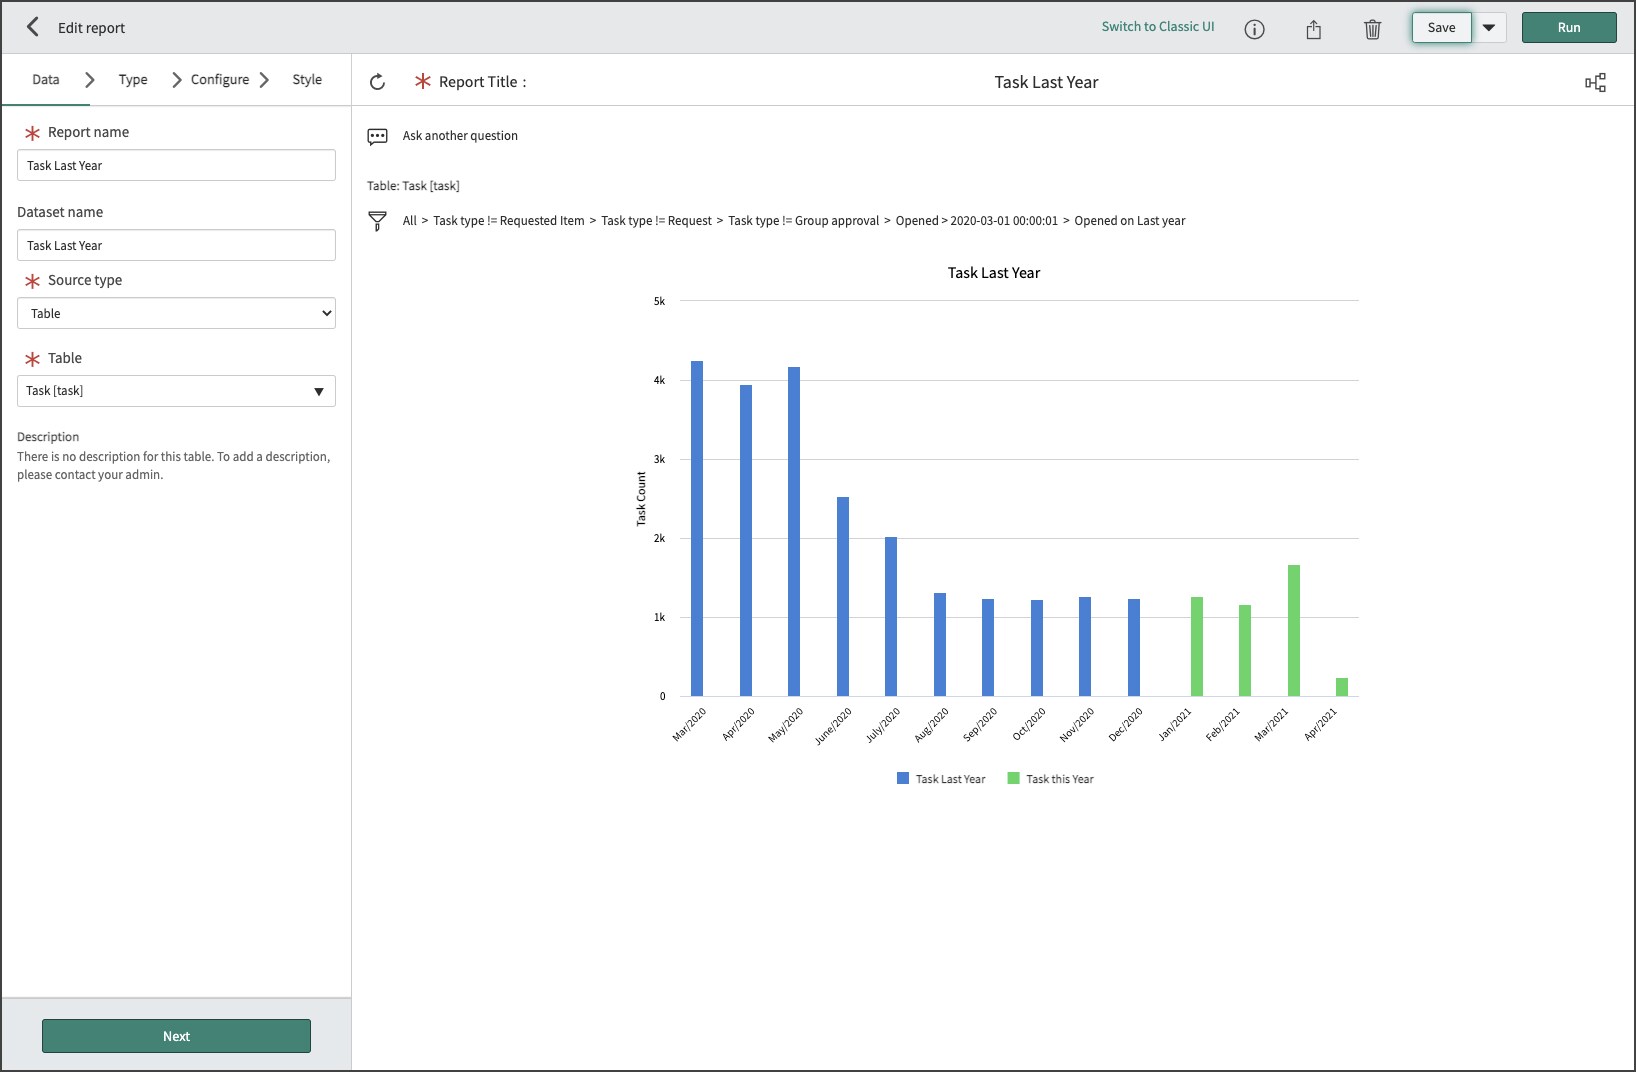
I'm trying to create a trend report between a year. I have it populating data but it's not starting at the correct date. The below parameters are what I am using. However, the first month displayed is May 2020. I've tried extending the opened after a couple more months but that didn't help. There are tickets between Jan - April 2020 that should display. I'm not sure what I am missing if someone could point me in the right direction please. Thank you!


Solved! Go to Solution.
- Labels:
-
Reporting
- Mark as New
- Bookmark
- Subscribe
- Mute
- Subscribe to RSS Feed
- Permalink
- Report Inappropriate Content
04-06-2021 08:14 AM
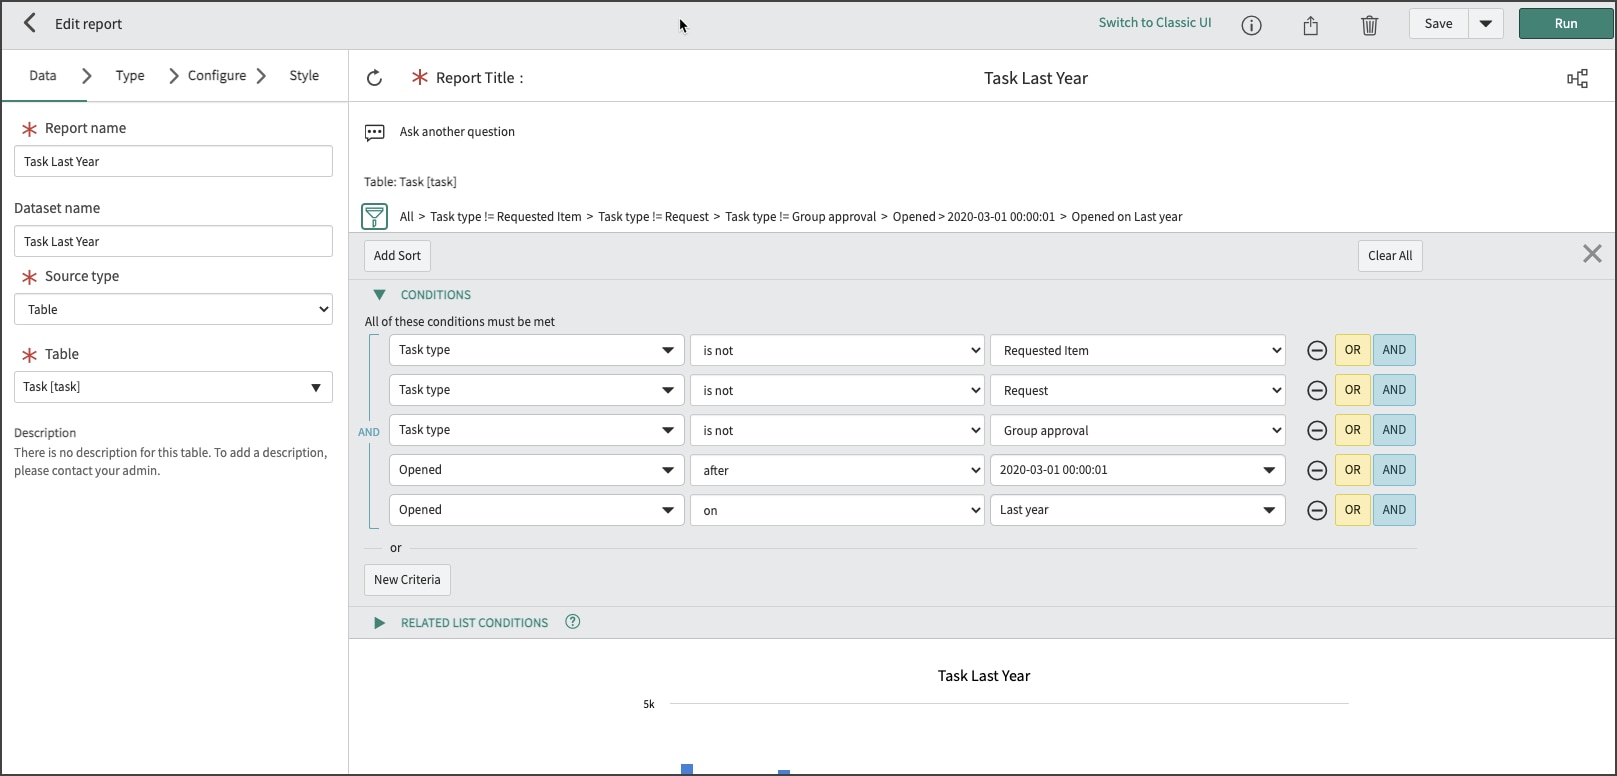
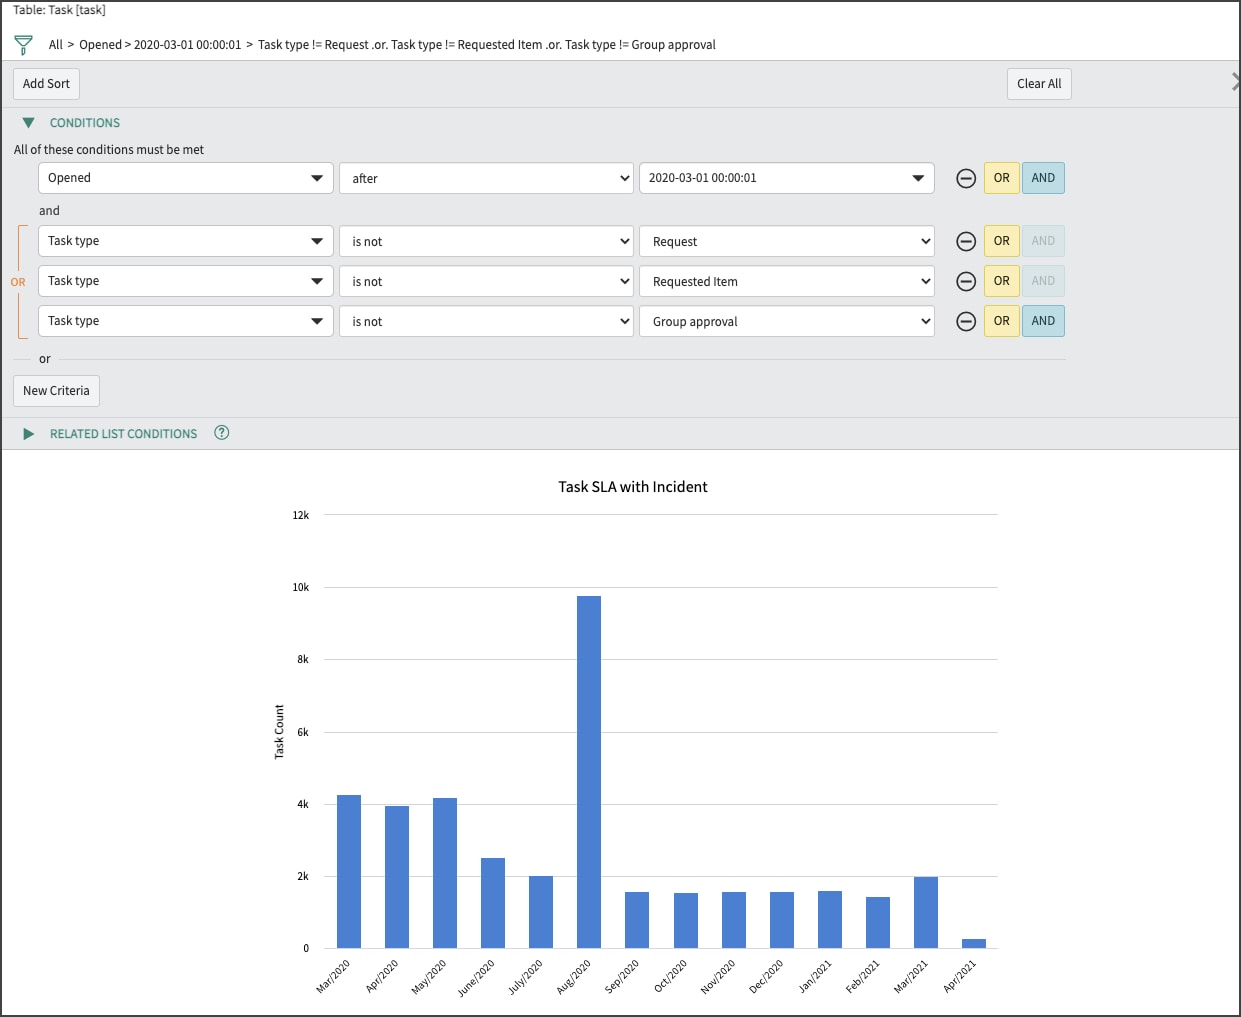
Here is another option, your first dataset will be Last Year and the additional dataset will be This Year. When you build it like this with these filters, it will get rid of the Other column. Here is a ServiceNow doc that talks about Additional Datasets:
https://docs.servicenow.com/bundle/quebec-now-intelligence/page/use/reporting/concept/c_MultipleData...


Create another Dataset as well to attach to the report. One dataset will be Last Year and one will be This Year.

This is what your additional dataset will look like:

- Mark as New
- Bookmark
- Subscribe
- Mute
- Subscribe to RSS Feed
- Permalink
- Report Inappropriate Content
04-06-2021 07:20 AM
Had the wrong response in the first reply, sorry.
Try using Opened Between 01/01/2020 00:00:01 and 04/31/2020 23:59:59
- Mark as New
- Bookmark
- Subscribe
- Mute
- Subscribe to RSS Feed
- Permalink
- Report Inappropriate Content
04-06-2021 07:27 AM
Thanks Thomas for the quick response. We were trying to gather stats for tickets before covid and since we have been working from home. It would be March 2020 to now is what I'm trying to gather. However my issue is that no more months are coming up even if I specify later dates like the beginning of the year. I'm missing March and April of 2020.
- Mark as New
- Bookmark
- Subscribe
- Mute
- Subscribe to RSS Feed
- Permalink
- Report Inappropriate Content
04-06-2021 07:36 AM

- Mark as New
- Bookmark
- Subscribe
- Mute
- Subscribe to RSS Feed
- Permalink
- Report Inappropriate Content
04-06-2021 07:40 AM
