- Mark as New
- Bookmark
- Subscribe
- Mute
- Subscribe to RSS Feed
- Permalink
- Report Inappropriate Content
04-06-2021 07:05 AM
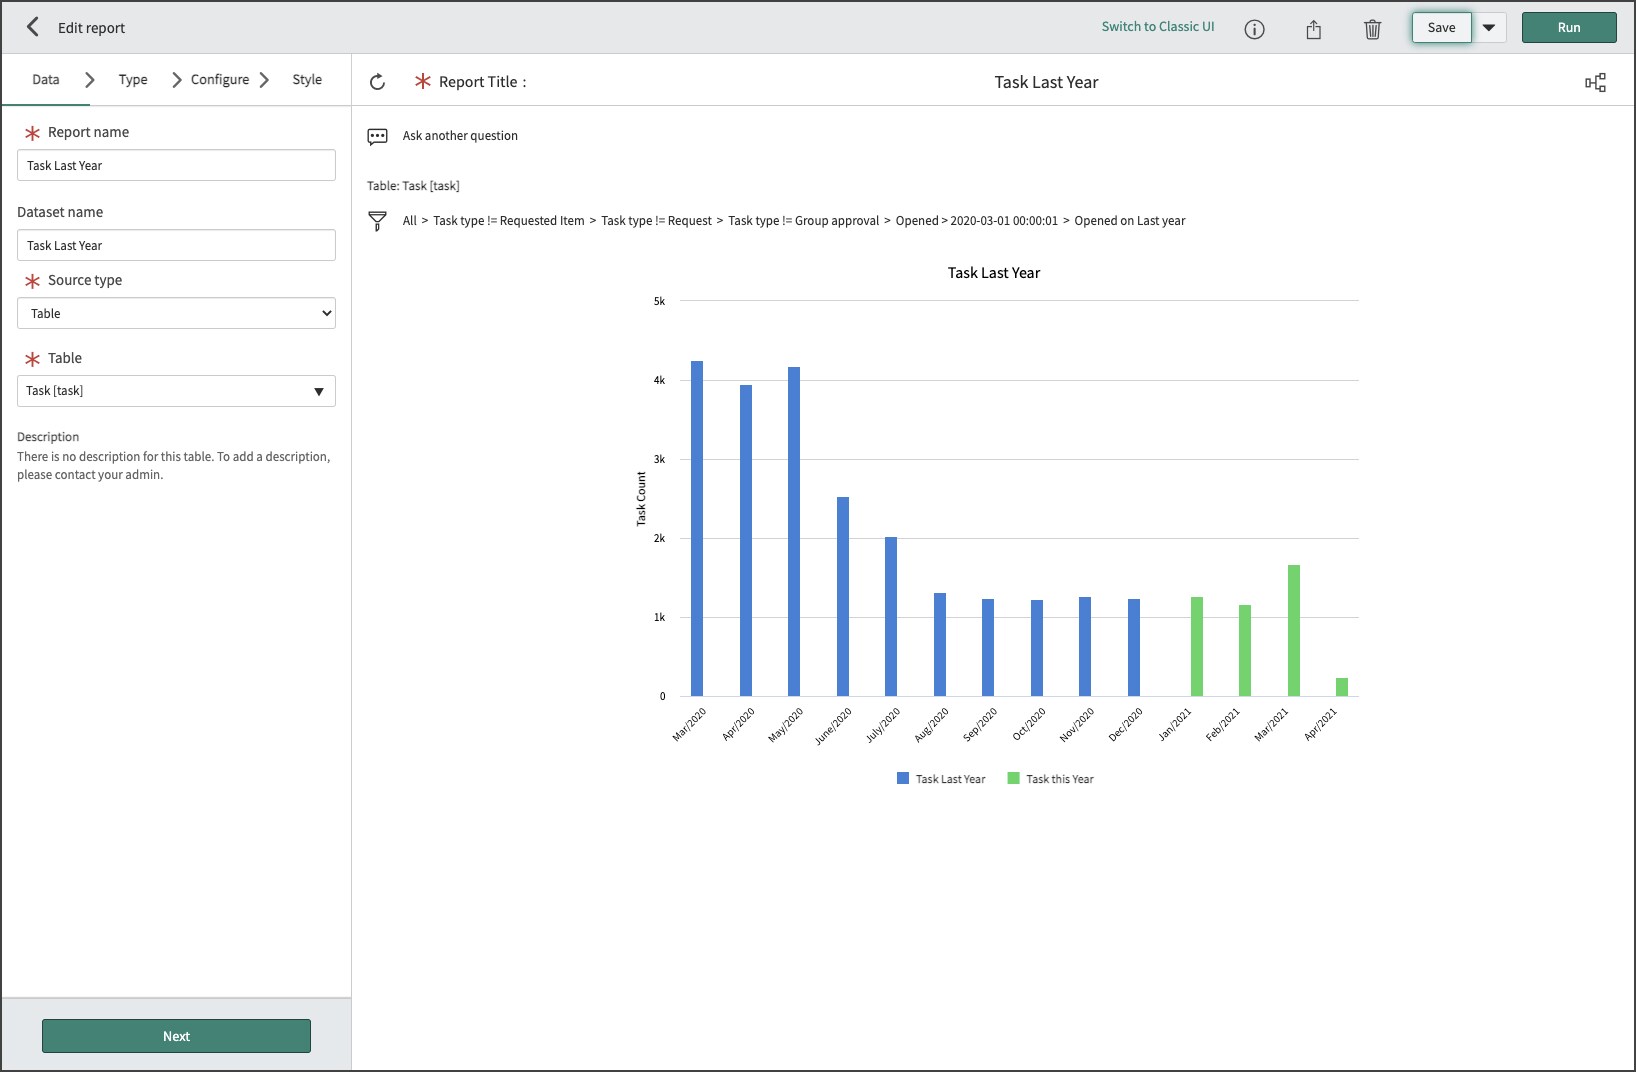
I'm trying to create a trend report between a year. I have it populating data but it's not starting at the correct date. The below parameters are what I am using. However, the first month displayed is May 2020. I've tried extending the opened after a couple more months but that didn't help. There are tickets between Jan - April 2020 that should display. I'm not sure what I am missing if someone could point me in the right direction please. Thank you!


Solved! Go to Solution.
- Labels:
-
Reporting
- Mark as New
- Bookmark
- Subscribe
- Mute
- Subscribe to RSS Feed
- Permalink
- Report Inappropriate Content
04-06-2021 08:14 AM
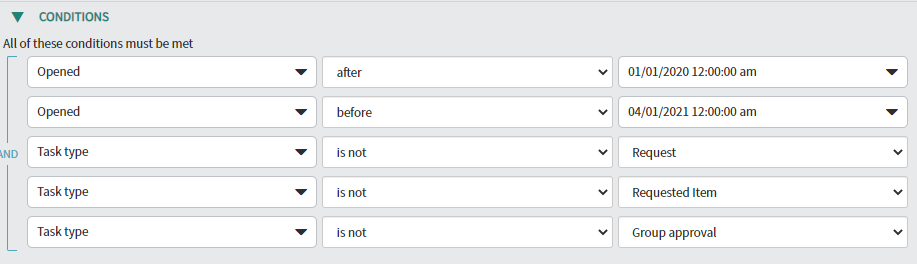
Here is another option, your first dataset will be Last Year and the additional dataset will be This Year. When you build it like this with these filters, it will get rid of the Other column. Here is a ServiceNow doc that talks about Additional Datasets:
https://docs.servicenow.com/bundle/quebec-now-intelligence/page/use/reporting/concept/c_MultipleData...


Create another Dataset as well to attach to the report. One dataset will be Last Year and one will be This Year.

This is what your additional dataset will look like:

- Mark as New
- Bookmark
- Subscribe
- Mute
- Subscribe to RSS Feed
- Permalink
- Report Inappropriate Content
04-06-2021 07:51 AM
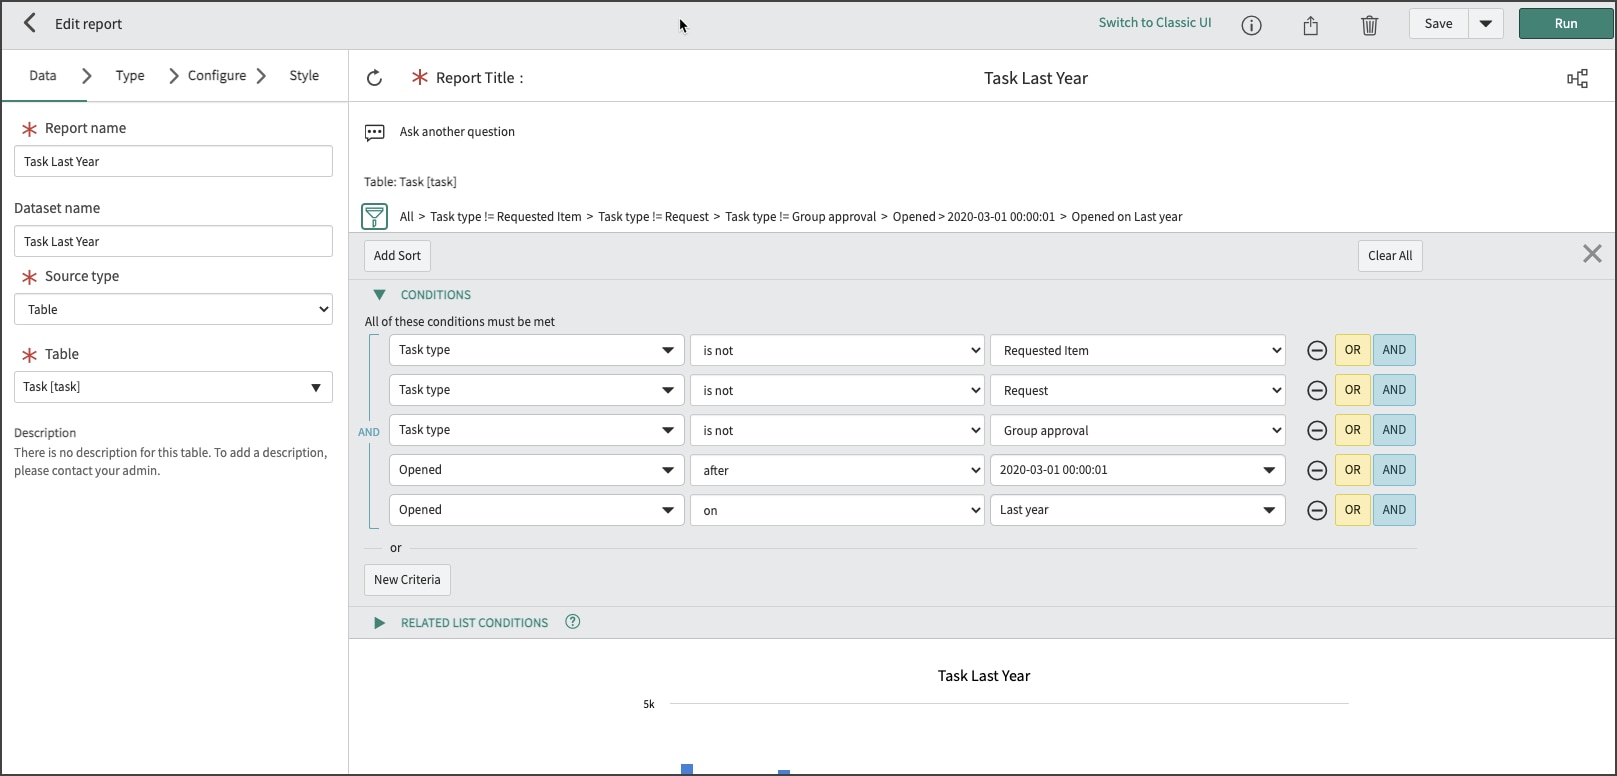
That brought in the extra two months. Kind of weird to have to add a second in there to bring them in. Do you know why that is? However, I now have an other column. I see that there is a check box to either show other or not show other. The other column is actually March 2021 and April 2021. Any idea on how that would happen? I'm thinking that 12 months is probably the max that you can display right?

- Mark as New
- Bookmark
- Subscribe
- Mute
- Subscribe to RSS Feed
- Permalink
- Report Inappropriate Content
04-06-2021 08:14 AM
Here is another option, your first dataset will be Last Year and the additional dataset will be This Year. When you build it like this with these filters, it will get rid of the Other column. Here is a ServiceNow doc that talks about Additional Datasets:
https://docs.servicenow.com/bundle/quebec-now-intelligence/page/use/reporting/concept/c_MultipleData...
Create another Dataset as well to attach to the report. One dataset will be Last Year and one will be This Year.
This is what your additional dataset will look like:
- Mark as New
- Bookmark
- Subscribe
- Mute
- Subscribe to RSS Feed
- Permalink
- Report Inappropriate Content
04-06-2021 08:28 AM
Wow, thanks for this. I didn't know you could create multiple datasets inside a report. This could help out with some items down the road for me. Thanks for helping me out.
- Mark as New
- Bookmark
- Subscribe
- Mute
- Subscribe to RSS Feed
- Permalink
- Report Inappropriate Content
04-06-2021 08:40 AM
Here is a Performance Analytics Academy, where I talked more about it if you want to check it out.
https://community.servicenow.com/community?id=community_blog&sys_id=5a3e245edb750490feb1a851ca961980