unable to see or generate bar graph , pie chart or any other visualization
- Mark as New
- Bookmark
- Subscribe
- Mute
- Subscribe to RSS Feed
- Permalink
- Report Inappropriate Content
03-19-2024 04:44 PM
- Mark as New
- Bookmark
- Subscribe
- Mute
- Subscribe to RSS Feed
- Permalink
- Report Inappropriate Content
03-19-2024 10:30 PM - edited 03-19-2024 10:32 PM
Hi @1__TejasC,
Hope you are doing well.
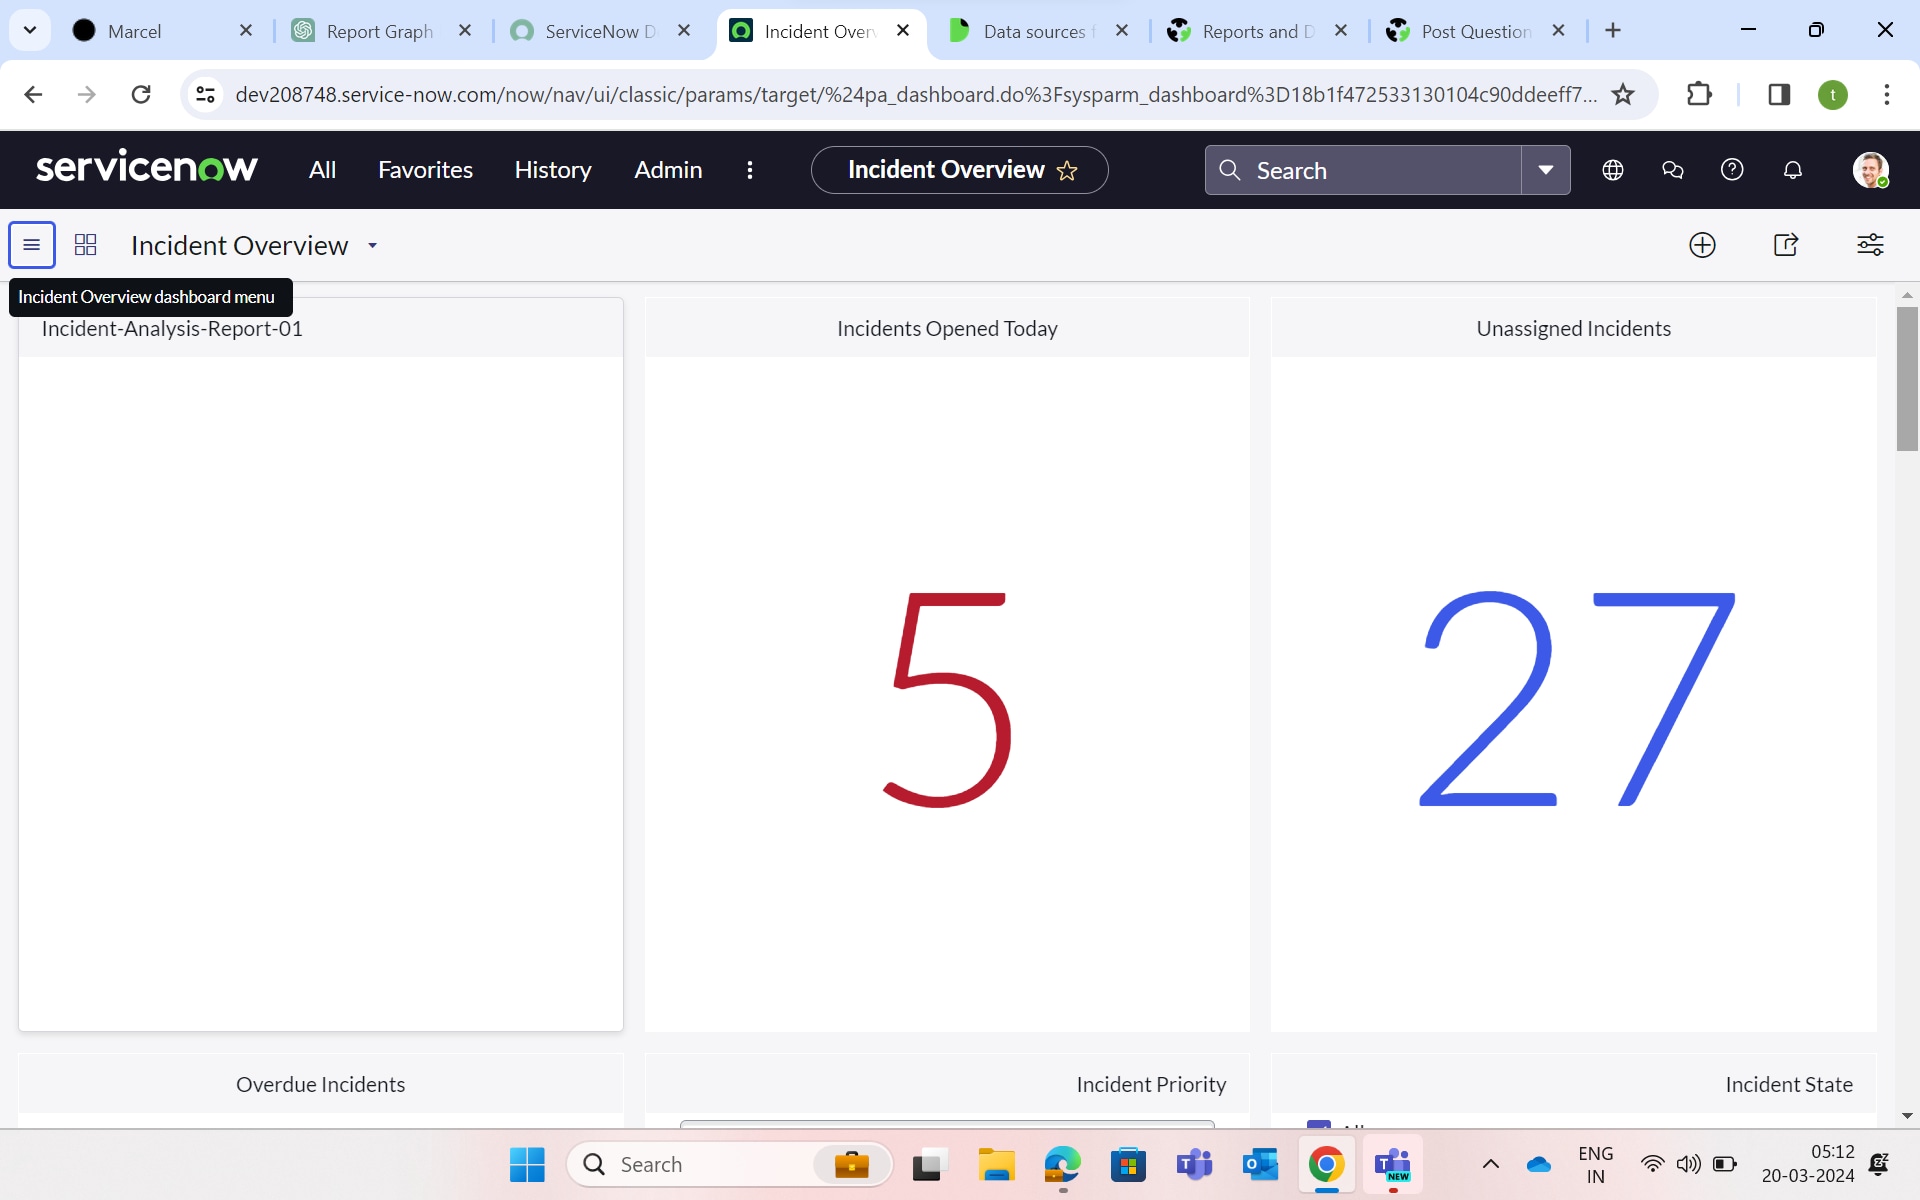
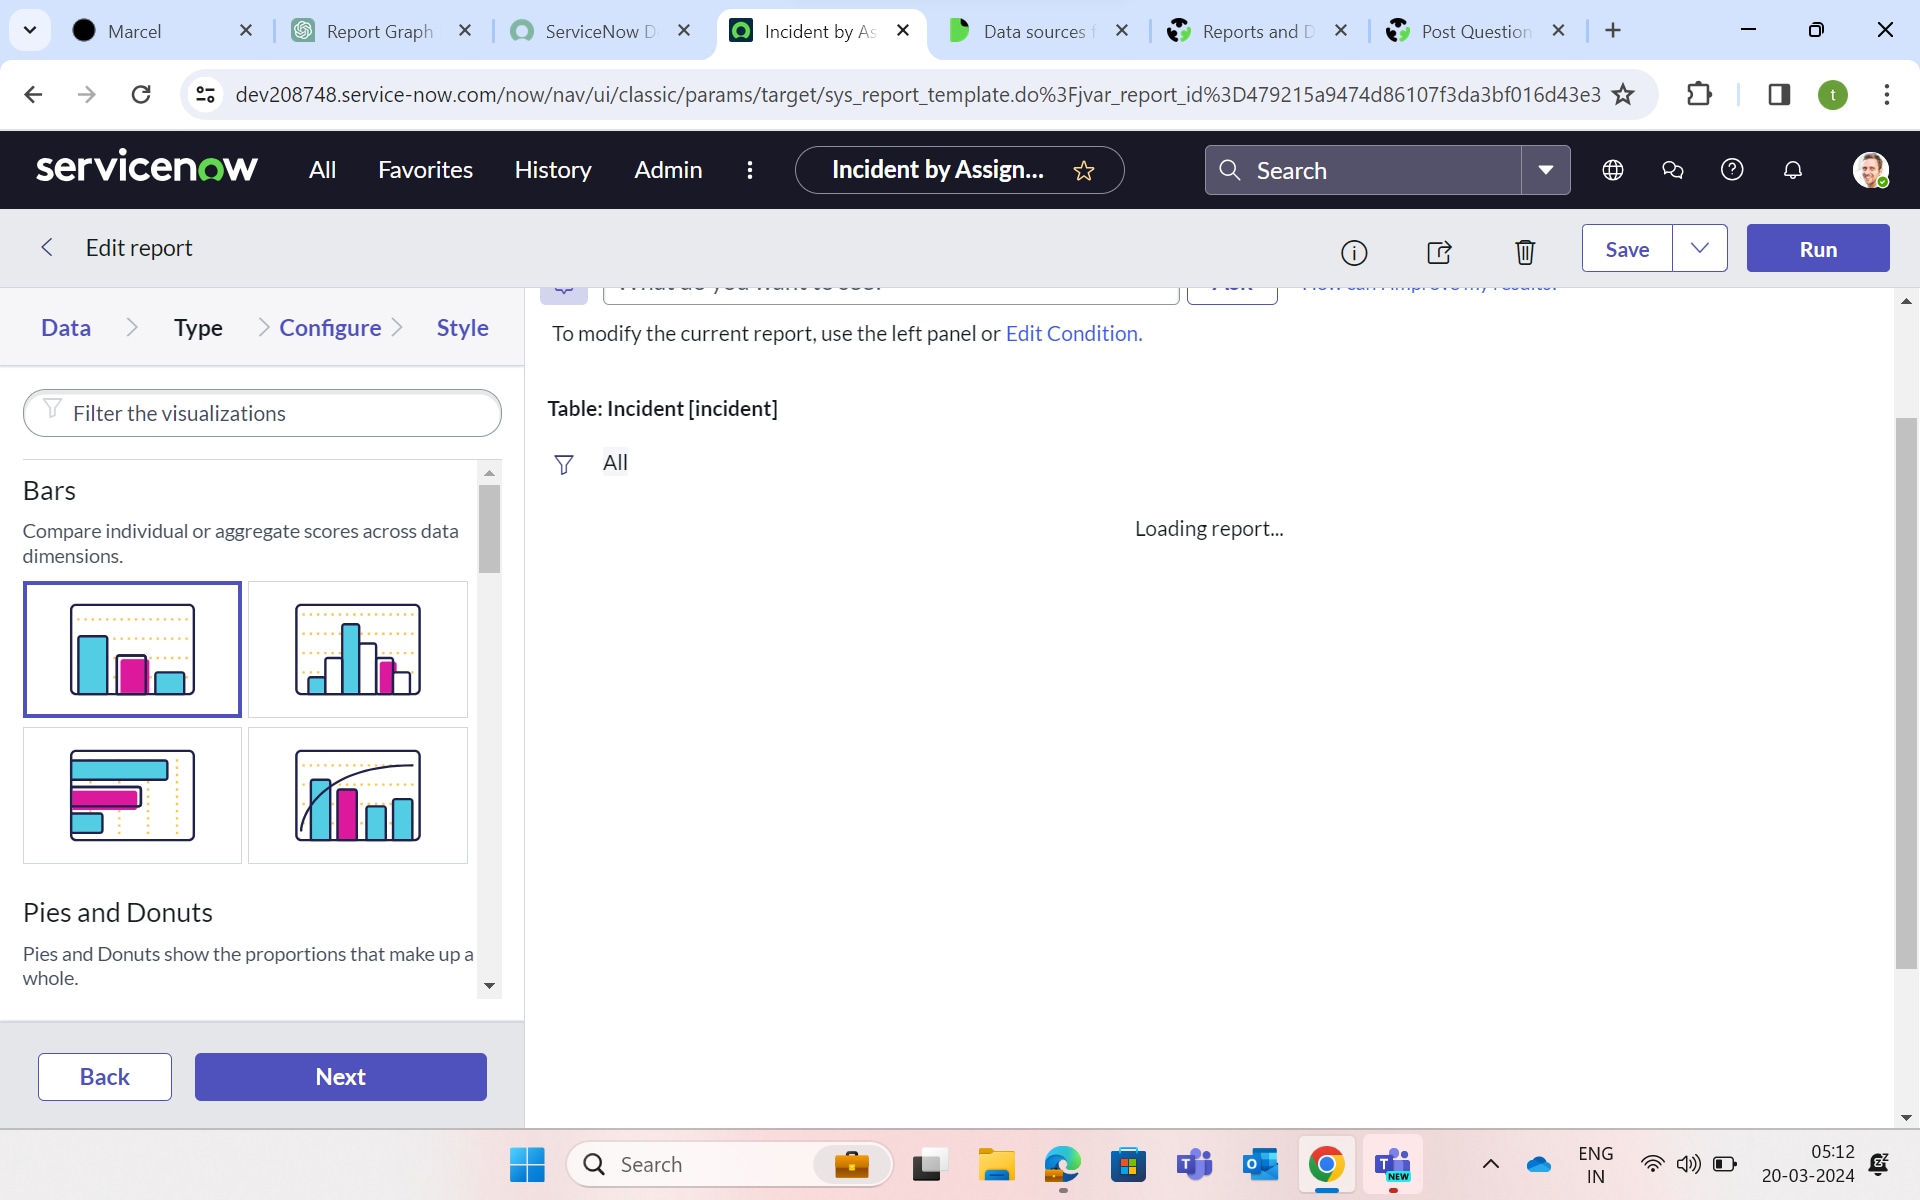
As per the screenshots shared by you, able to analyze that other reports are clearly visible on the dashboard. It just that you are struggling to create only one report. By analyzing the second screenshot, it can be seen that the report you are trying to visualize is taking longer time than expected as it is showing as "Loading Report". The reason might be that you are having many records on this table and taking time accordingly. As such, Unable to see any error message is displaying on the screen.
Suggestion: -
You can try to create report from the table itself (by right-click on the list header and then click on Bar Chart or Pie Chart option what best suits your requirement) if you are creating the report using "View/Run" Module or Create Report" UI Action Button or vice-versa.
If you find this answer/solution/suggestion as helpful to your question asked or meet with your requirement, you can mark this solution/answer/suggestion as helpful, and correct.
Thanks
Aakash Garg
ServiceNow Developer
- Mark as New
- Bookmark
- Subscribe
- Mute
- Subscribe to RSS Feed
- Permalink
- Report Inappropriate Content
03-22-2024 02:21 AM
No I tried everything, In second screenshot where it is showing loading report, it finally ended up in displaying blank page,I tried creating report from table ,even that didn't work
- Mark as New
- Bookmark
- Subscribe
- Mute
- Subscribe to RSS Feed
- Permalink
- Report Inappropriate Content
03-22-2024 02:44 AM
Hi @1__TejasC,
Hope you are doing well.
As of now, I can't give you any other solution for this without seeing this in front of my eyes. Let me know, if we can connect through any medium where you can share your screen and get it resolved.
Thanks 🙂
Aakash Garg
ServiceNow Developer
- Mark as New
- Bookmark
- Subscribe
- Mute
- Subscribe to RSS Feed
- Permalink
- Report Inappropriate Content
02-20-2025 12:24 AM
My client is also having the same issue, did you ever find a solution to this problem?