- Mark as New
- Bookmark
- Subscribe
- Mute
- Subscribe to RSS Feed
- Permalink
- Report Inappropriate Content
01-15-2019 07:23 AM
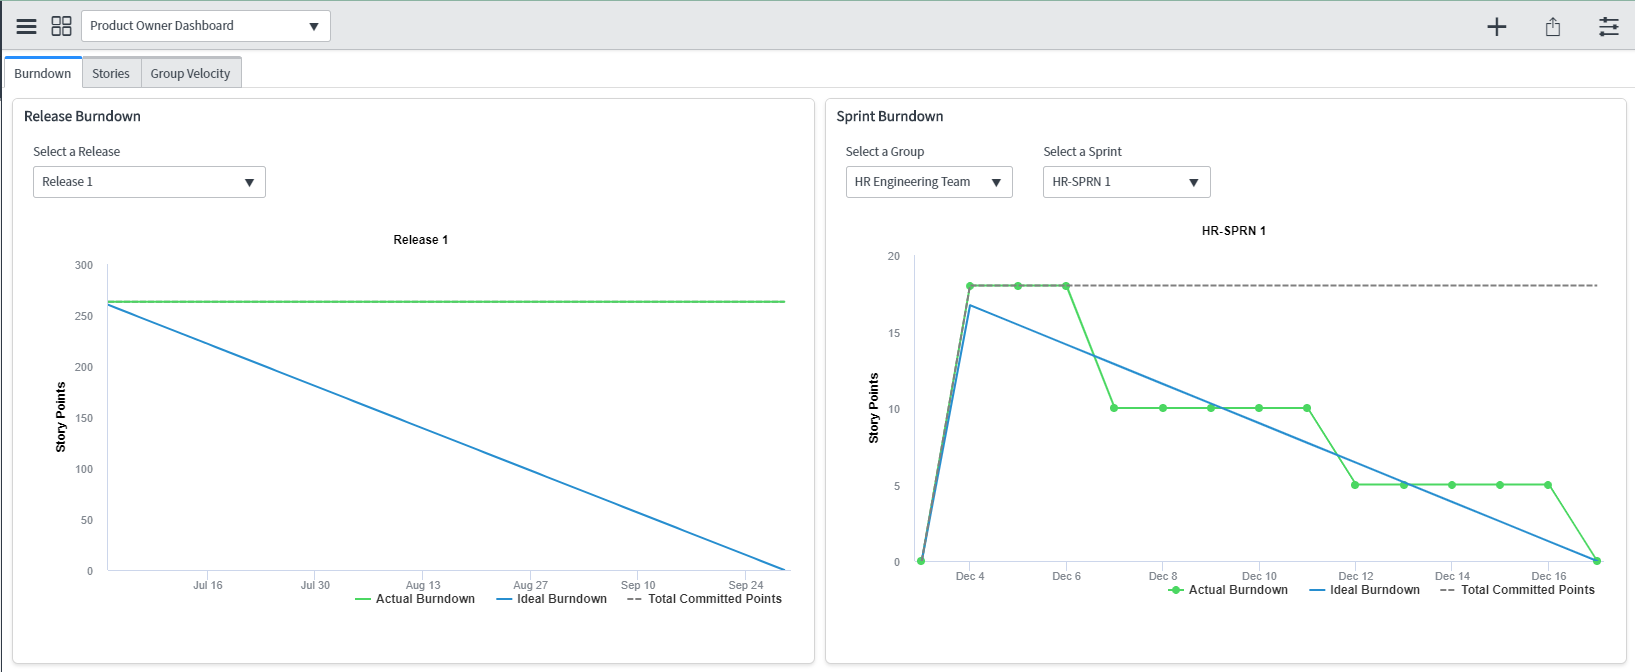
Hi, is there a way to customise/adatp the OOB burndown chart? It seems to work quite differently from the rest of the widgets in the platform.


Both Product Owner Dashboard and Agile Board Analytics don't seem to be standard widgets/reports in the platform but pages.

And then the page itself seems to use a lot of things that are not accessible to developers.

What can be done if we need to add another filter to the burndown widget? For example Project instead of just Group/Sprint.
Thanks
Solved! Go to Solution.
- Labels:
-
Agile Development
- Mark as New
- Bookmark
- Subscribe
- Mute
- Subscribe to RSS Feed
- Permalink
- Report Inappropriate Content
01-16-2019 04:43 AM
Hi,
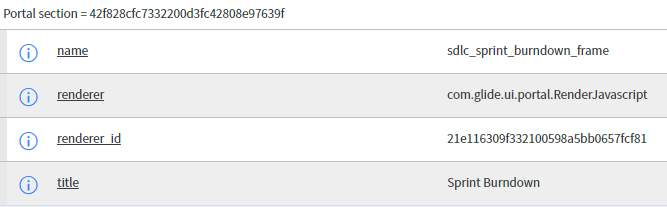
Release burndown and Sprint Burndown are not PA widgets as PA doesn't support plotting a graph for specific start and end dates. For adding a new filter or modifying a filter you have to do code in the mentioned files.
Sprint Burndown:
Release Burndown:
Thanks
DastagiriReddy
- Mark as New
- Bookmark
- Subscribe
- Mute
- Subscribe to RSS Feed
- Permalink
- Report Inappropriate Content
03-29-2021 06:13 AM
Thanks Miguel! It is a combination of being a SNow newbie and not looking close enough at the solution 🙂 Unfortunately, the administrators of the site have me locked down pretty good. I don't have access to this functionality 😞
Thanks again!
- Mark as New
- Bookmark
- Subscribe
- Mute
- Subscribe to RSS Feed
- Permalink
- Report Inappropriate Content
02-27-2023 10:54 PM
We have domain separated environment and we would like to do domain separated the Agile 2.0 Sprint Dashboard that means for a specific domain user this dashboard needs to visible. Could you please help me how we can do this. And sprint burnup and burn down I would like to know how this data is coming and for this don't find the any widgets are reports for this.
- Mark as New
- Bookmark
- Subscribe
- Mute
- Subscribe to RSS Feed
- Permalink
- Report Inappropriate Content
03-30-2024 06:12 AM
My company has everything locked down also. Plus, I'm not one that wants to write code to make this happen. Isn't there a SN point and click, select and paste solution in the UI to add a burndown chart to my dashboard without having to be a SN scientist?