- Post History
- Subscribe to RSS Feed
- Mark as New
- Mark as Read
- Bookmark
- Subscribe
- Printer Friendly Page
- Report Inappropriate Content
on 04-26-2021 12:00 PM
This is a two-part series; in Part 1 we’ll review how Automation Discovery can help you find automation opportunities in your data fast. In Part 2, I’ll walk you through the installation and creation of your first Automation Discovery report.
Introduction to Automation Discovery
ServiceNow’s mission is to make the world of work, work better for people. One way we do that is through the automation of manual/repetitive tasks freeing ServiceDesk agents to tackle complex issues. In April we released Automation Discovery (as a store app), to help process owners identify ITSM automation opportunities in their data using Machine Learning. The automation analysis is delivered in an easy-to-read Automation Discovery report with executive level metrics and recommendations. * Please note – I am showing the Automation Discovery on Quebec, this will look different on Orlando/Paris.
Using Automation Discovery is easy, if you can build a report in ServiceNow you can use Automation Discovery. In Part 2 of this series I go into detail in how to do this. In Quebec, Automation Discovery identifies areas that can be automated using the ServiceNow Virtual Agent; in future updates we will identify areas we can automate through Predictive Intelligence, Agent Assist, and other platform capabilities.
Automation Discovery is unique in that we use Predictive Intelligence to align your data with common ITSM use cases, which we call Automation Opportunities. Any records that we are unable to map we cluster, into patterns using HDBScan to make it easy to identify where you need to do custom development.
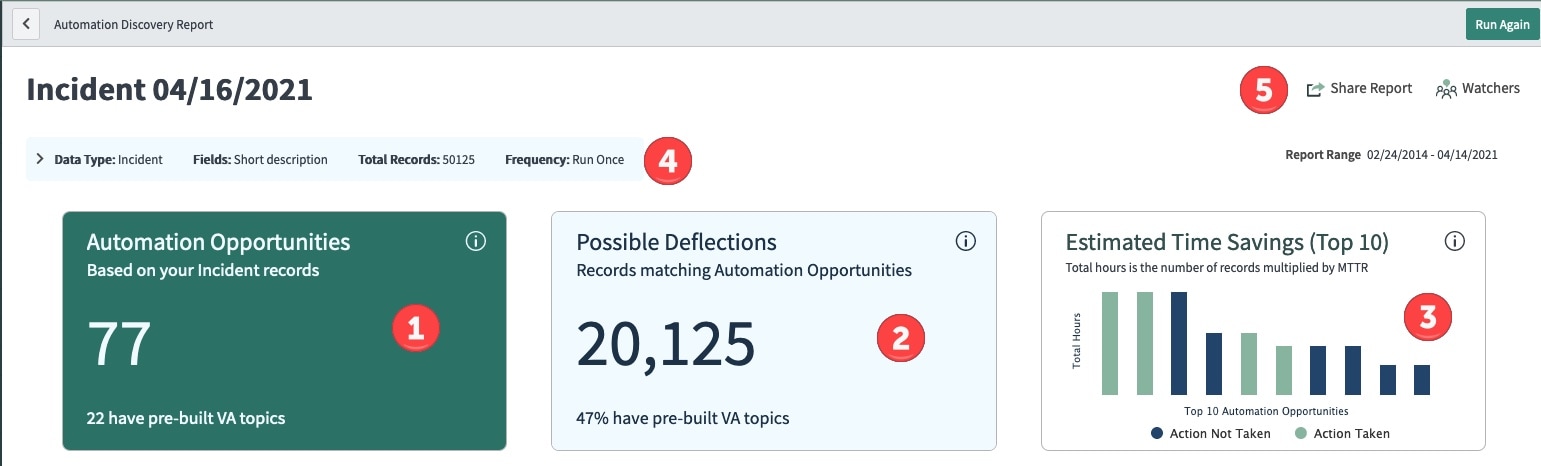
Automation Discovery creates a preview in about 15 minutes and typically will complete the full analysis in about 30minutes. After the analysis completes you are provided with the below report that contains an executive summary and details of automation opportunities in your data (Figure 1)

Figure 1 – an Automation Discovery Report against the Incident table
Automation Opportunities Summary Metrics

Figure 2 – Summary of automation opportunities
The red circles 1, 2, 3 are high level score cards that show automation opportunities, possible deflections, and estimated time savings. You can click the information icon to flip the score card to see details on the back of the card. The query conditions are pointed out by red circle 4. Red circle 5 points out that you can share the report, add watchers, and print a PDF of the report.
Drilling deeper into the three score cards
On the Automation Opportunities card (Figure 3) we have identified 77 automation opportunities and we have 22 pre-built VA topics and intents that may help you deflect these incidents.
Figure 3 – Automation Opportunities

On the Possible Deflections card (Figure 4) – Automation Discovery identifies 20,125 incidents that can be automated and 47% (9,510) of those incidents might be deflected using pre-built Virtual Agent topics. *Please Note that pre-built Virtual Agent topics is a feature only available on the Quebec version.
Figure 4 – Possible Deflections

We calculate the Estimated Time Savings ( Figure 5) and display it as a bar chart. This metric is helpful to determine the time savings if action is taken to automate. The green bar means we have already mapped an automation opportunity to an NLU model while the blue bar means we have yet to take action to automate.

Figure 5 – Estimated Times Savings
Automation Opportunities Tab
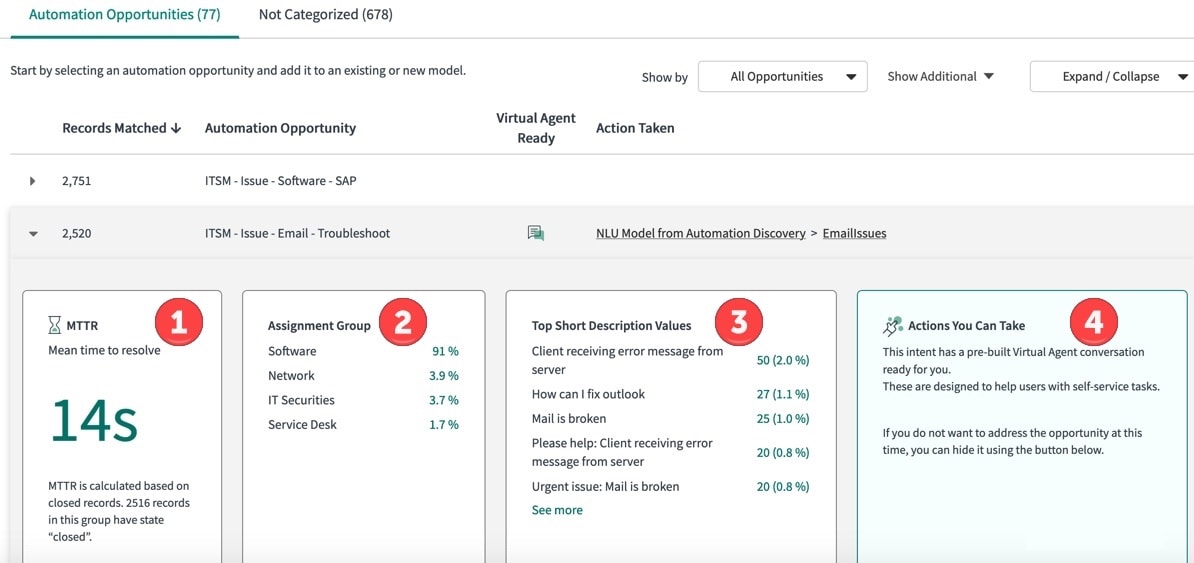
Below (figure 6) the summary metrics you will see more detail around how your incidents were grouped. The first tab represents the 77 Automation Opportunities. Automation Discovery grouped 2,520 incidents under Automation Opportunity category ITSM-Issue-Email-Troubleshoot and it’s flagged this category as Virtual Agent Ready; meaning these incidents can potentially be automated and deflected using Virtual Agent. I can also see the latest actions taken, for example below I show that I have already taken action on ResetPassword.

Figure 6 – Automation Opportunities Detail tab
Expanding the ITSM-Issue-Email-Troubleshoot category (Figure 7) I can see helpful details around the incidents matched to this category. Reading from left to right I can see that the MTTR is 14 seconds(1) for the 2,520 incidents that fall under the ITSM-Issue-Email-Troubleshoot category. The Assignment Group distribution(2), shows that we have 3.9% of the email issues are routed to the Network group. The Top Short Description Values(3) show the patterns of how employees ask for help around email issues, we can see common culprits such as 27 incidents with How can I fix outlook as the short description. Finally, we will recommend actions that you can take(4); the action recommendation will evolve with each new store update.

Figure 7 – ITSM-Issue-Email-Troubleshoot
Not Categorized Records
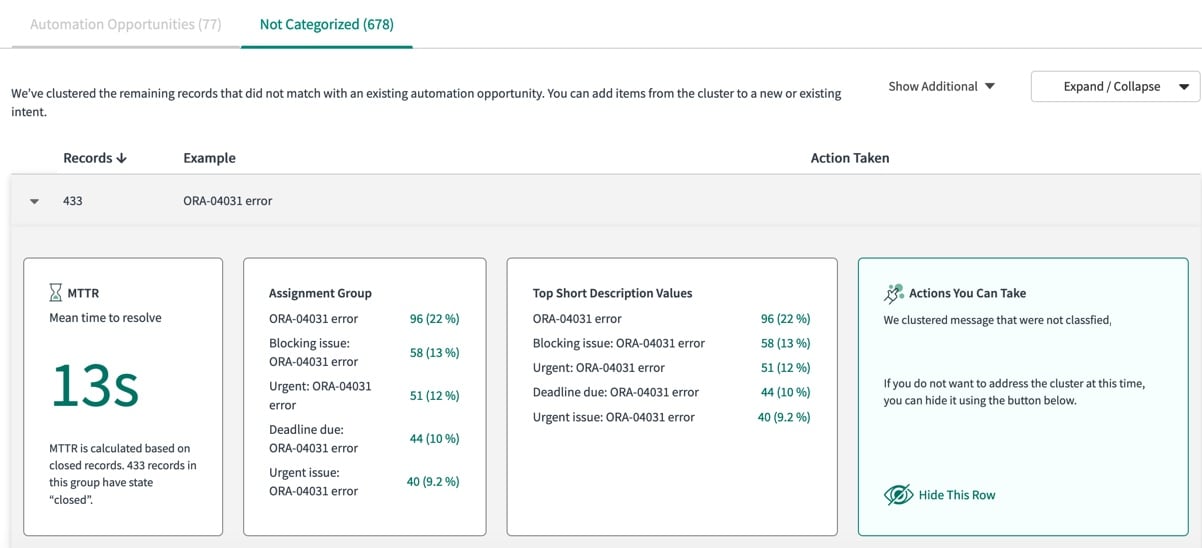
Incidents that we are unable to map against ServiceNow’s ITSM Taxonomy are clustered using HDBScan and are presented in the Not Categorized tab (Figure 8). The non-categorized incident clusters are useful to review as they may present additional opportunities to automate.

Figure 8 – Not categorized incidents
For example, expanding the ORA-04031 category may identify patterns for potential ITOM event aggregation candidates. (Figure 9).

Figure 9 – Expansion of ORA-04031 error
Summary
Automation Discovery is a fast way to identify ITSM automation opportunities that can be solved with Virtual Agent. In future releases we will identify automation opportunities that be addressed by different platform capabilities such as Predictive Intelligence and Agent Assist.
Please look for Part 2 of this series to learn how to install and create your first Automation Discovery report.
