Display SLA attainment as a percentage in a line graph
- Mark as New
- Bookmark
- Subscribe
- Mute
- Subscribe to RSS Feed
- Permalink
- Report Inappropriate Content
07-11-2025 08:10 AM
Hi all,
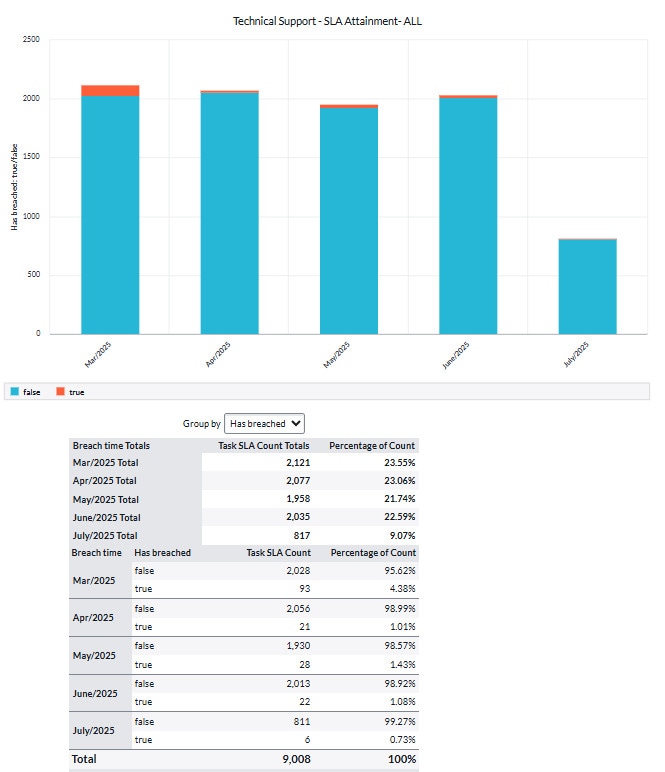
We recently moved from Salesforce to ServiceNow CSM (Yokohama) and I'm rebuilding our KPI dashboard. An important KPI for us is SLA attainment in % over time (I attached a screen view of what that looked like in Salesforce).
However, in ServiceNow I only manage to get the [Has breached] scores in absolute numbers (see attached). I know that you can view the percentage when you hover over the lines and also that you can display the values in a table under the graph, but it does my head in that I don't find how to visualize the actual scores in % instead of absolute numbers.
Any ideas what I'm missing?
Thanks!
Judith
- Mark as New
- Bookmark
- Subscribe
- Mute
- Subscribe to RSS Feed
- Permalink
- Report Inappropriate Content
07-11-2025 08:13 AM
Apologies, wrong forum! Ignore...