BigCharts-R1: Enhanced Chart Reasoning With Visual Reinforcement Finetuning
Abstract
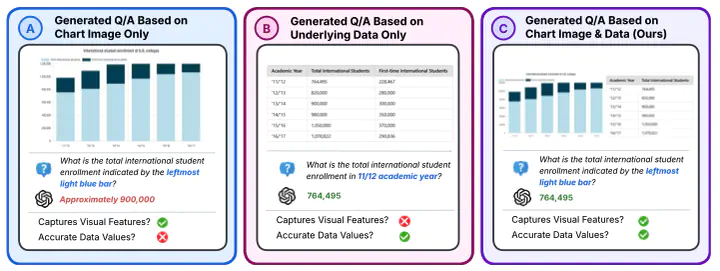
Chart understanding is critical for ServiceNow for data analysis, reason over visualizations, such as interpreting trends, identifying anomalies, or for summarizing insights. However, existing vision-language models (VLMs) often struggle with chart comprehension due to limited training on diverse, real-world data and reliance on noisy, auto-extracted chart tables. To overcome these limitations, we introduce BigCharts, a dataset pipeline that generates visually diverse and realistic chart images by replotting real-world charts from multiple platforms, preserving both authenticity and data accuracy. We further propose a training framework that combines supervised fine-tuning with Group Relative Policy Optimization (GRPO)-based reinforcement learning, guided by chart-specific reward signals. Our resulting model, BigCharts-R1, demonstrates state-of-the-art performance on multiple chart QA benchmarks, offering a robust solution for chart understanding in enterprise contexts like ServiceNow.
Perouz Taslakian
Research Lead
Research Lead at Frontier AI Research located at Montreal, QC, Canada.
David Vazquez
Director of AI Research
Director of AI Research at AI Research Management located at Montreal, QC, Canada.
Christopher Pal
Distinguished Scientist
Distinguished Scientist at AI Research Partnerships & Ecosystem located at Montreal, QC, Canada.
Abhay Puri
Applied Research Scientist
Applied Research Scientist at AI Research Deployment located at Montreal, QC, Canada.
Spandana Gella
Research Manager
Research Manager at Frontier AI Research located at Montreal, QC, Canada.