


jgates

ServiceNow Employee
Options
- Subscribe to RSS Feed
- Mark as New
- Mark as Read
- Bookmark
- Subscribe
- Printer Friendly Page
- Report Inappropriate Content
09-14-2021
01:05 PM
Introduction
The Service Graph Connector for Observability Dynatrace connector is the 2nd generation of the Service Graph Connector for Dynatrace application. The 1st generation Service Graph Connector for Dynatrace was developed by Dynatrace with consultation from ServiceNow. The new Service Graph Connector for Observability Dynatrace is developed by ServiceNow.
The 2nd generation connector leverages the standard Service Graph Connector architecture. This includes using connection and credential aliases, data sources, scheduled data imports, integration hub data streams, robust transform engine (RTE), integration hub ETL (IH-ETL), the identification and reconciliation engine (IRE), and the common service data model (CSDM). The first generation Dynatrace connector did not leverage a lot of these features and did not follow standard Service Graph architecture.
A high level of the data mapping:
|
Dynatrace |
ServiceNow |
|
Application |
Calculated Application Service (cmdb_ci_service_calculated) |
|
Service |
Calculated Application Service (cmdb_ci_service_calculated) |
|
Process Group |
Group (cmdb_ci_group) |
|
Process |
Application (cmdb_ci_appl) |
|
Host |
Computer (cmdb_ci_computer) |
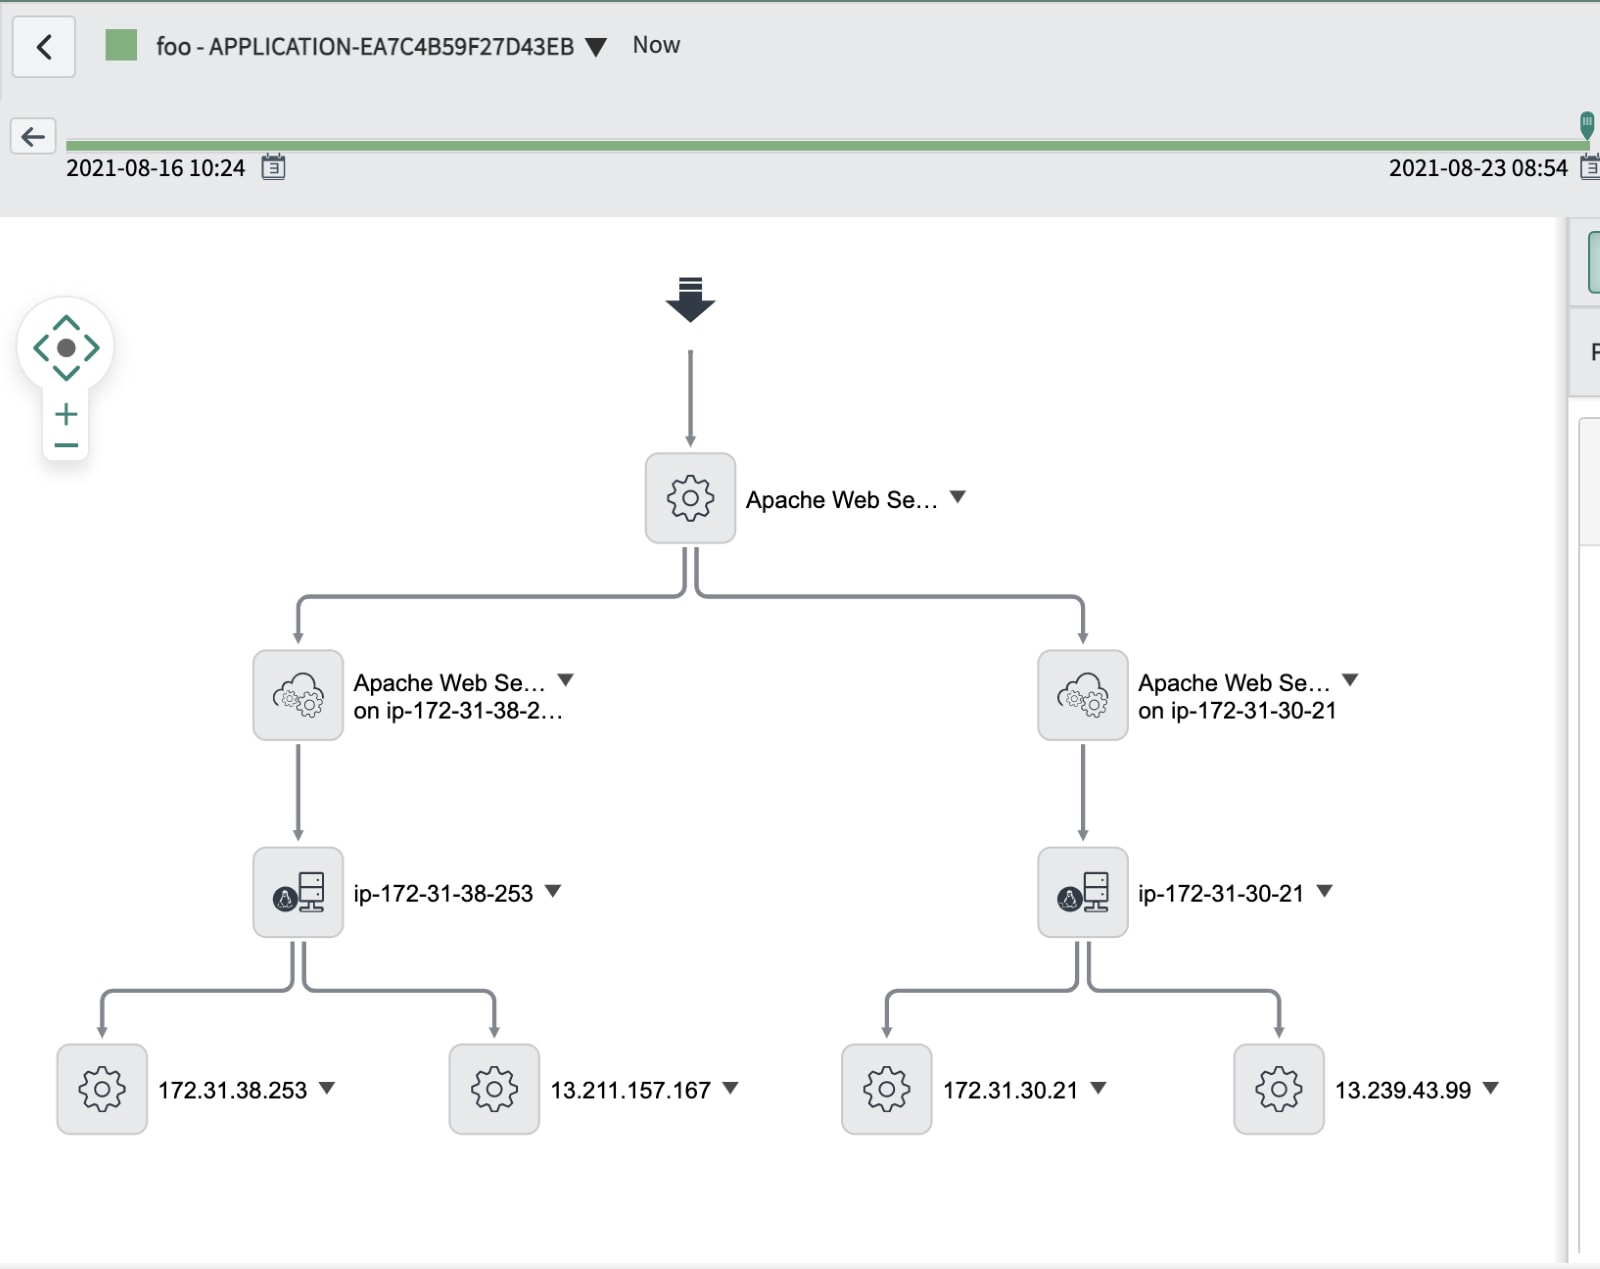
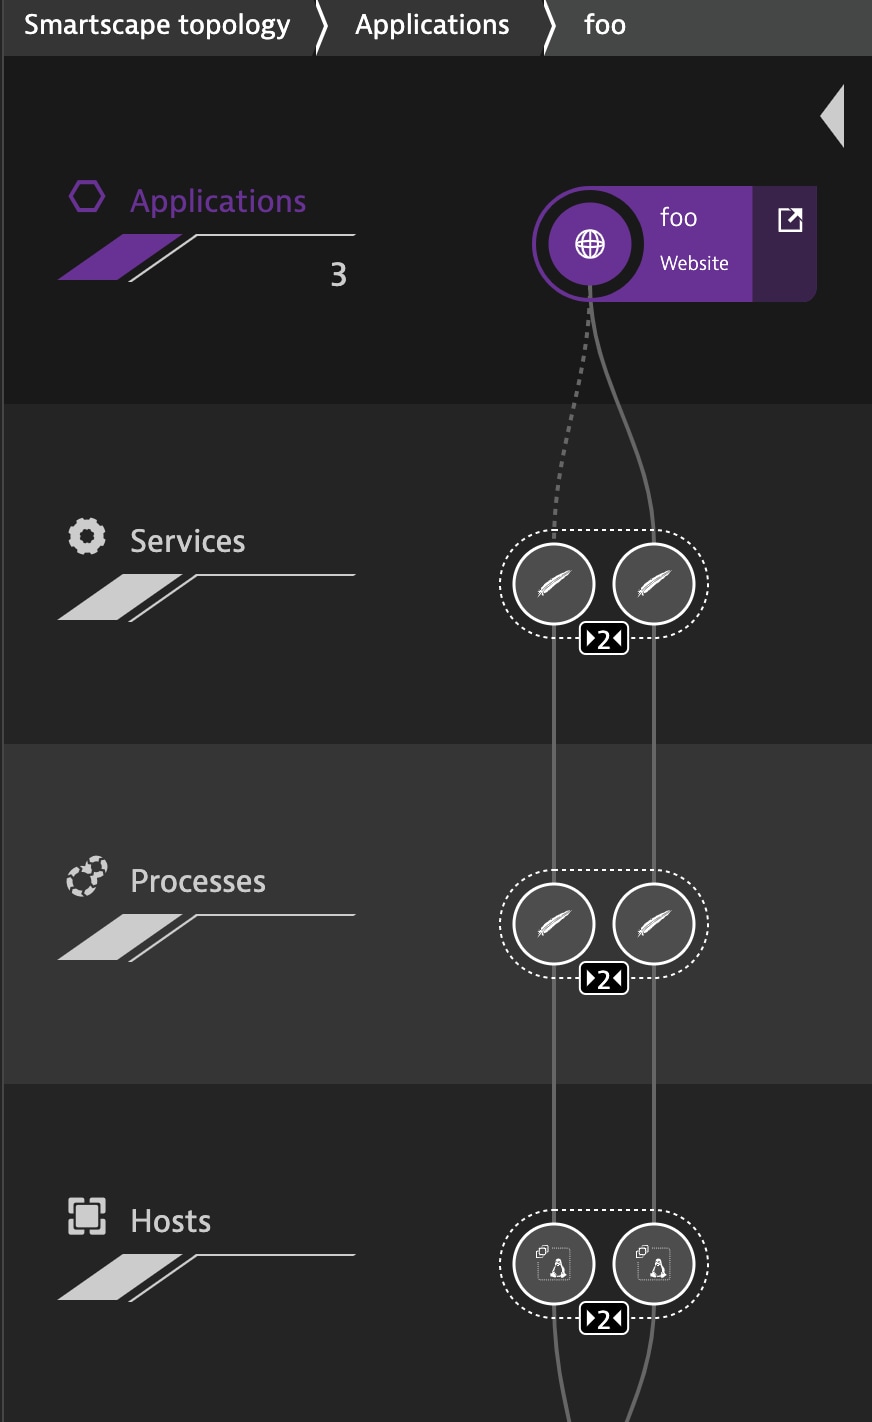
And the service maps can be seen as follows.
From Dynatrace:
To ServiceNow:

Differences between Service Graph Connector for Dynatrace and Service Graph Connector for Observability Dynatrace
| Feature | Service Graph Connector for Dynatrace | Service Graph Connector for Observability Dynatrace | Difference Comments |
| Data Retrieval | Rest V2 | Integration Hub Data Stream | Follows Service Graph standard |
| Dynatrace REST API | Dynatrace V1 | Dynatrace V2 | |
| Uses Data Source | No | Yes | Allows for import tables to store raw data from Dynatrace. Better visibility and debugging |
| Uses Connections and Credential Aliases | No | Yes | Follows Service Graph standard |
| Uses scheduled imports | No | Yes | Allows for concurrent imports |
| Uses RTE (Robust Transform Engine) | No | Yes | Previous version uses script. New version uses no code RTE. Allows for use of IH-ETL (integation hub etl) for mapping, transforming, and customizations) |
| Uses IH-ETL | No | Yes | No code customization of mapping and transforming |
| Uses IRE | Yes | Yes | IRE Payload is made by hand in script in previous version. The new version automatically creates the IRE payload. |
| Allows for filtering of Dynatrace Services | No | Yes | Added ability to filter Dynatrace services to limit the noise in the applicatoin service tables |
| Application Service Table | cmdb_ci_service_discovered | cmdb_ci_service_calculated | New version provides a better service map along with the automatted ability to show changes to dependent infrastructure |
| Tags | Brought into "comments" field | Uses cmdb_key_value table | New version properly stores tags |
| Standard Service Graph Pipeline | No | Yes | New version follows all the Service Graph standards. Learning one pipeline that will apply to all Service Graph connectors. |
| Consolidates Application Services With Service Mapping/Other SG Connectors | No | No | Application Services are designed to not overlap with other sources. |
| Bring in Process Group Data | No | Yes | New version brings in process groups to do some logical clustering of running processes |
| Event Management Functionality | No | Yes | The new connector ships with event management functionality. Including setup of all necessary components within Dynatrace through a REST API call |
| Metrics | No | Yes | The new connector brings in just in time metrics if metric base is installed and relevant metrics are available for the CI tied to an alert. |
| Logs | No | Yes | The new connector bring in just in time log data and attaches the log data to an alert if Dynatrace log data is available on the host. |
| Standard Service Graph Observability Pipeline | No | Yes | New version leverages a standard Service Graph Observability pipeline for ingest notifications from Dynatrace and generating events/alerts |
Requirements
An active Dynatrace environment that can be reached either with or without a mid-server is required.
The Dynatrace API needs to be:
- For ingesting CMDB data (mandatory): Dynatrace Release 177 (August 2019)
- For pushing configuration to Dynatrace for event management (optional, would require manual creation of push notifications in Dynatrace as documented) : Dynatrace Release 224 (15.July 2021)
The following roles are necessary on the API Token:
-
- Read entities (entities.read)
- For Observability
-
- Read configuration (ReadConfig)
- Write configuration (WriteConfig)
- Read logs (LogExport)
- Read metrics (metrics.read)
Upgrade
An upgrade from the 1st generation Service Graph Connector for Dynatrace integration to the 2nd generation Service Graph Connector for Observability Dynatrace is possible but is not recommended. Data from the 1st generation connector brings in a lot of unnecessary services and relationships that will cloud up the Service Maps and can cause performance issues if migrated to the 2nd generation connector. If it is necessary to preserve the data from the 1st integration there are steps during the guided setup of the Service Graph Connector for Observability Dynatrace application that will help guide the user through the upgrade process. Please refer to the documentation in the guided setup for further clarification. Because this is not a direct upgrade, but rather a replacement any scheduled jobs associated with the old connector must be disabled.
Setup
Follow the Setup module under the SG Connector for Observability Dynatrace module in the left navigation. The setup will guide the user through the migration from a previous version (see upgrade section of this article), basic configuration (connection and credentials, event notification setup), advanced settings, cleaning up old records, and scheduling the data imports. There is documentation within the guided setup as well as articles in the right help bar during each step of this process.
A few notes worth calling out:
-
- The API token must be prefixed with ‘api-token ‘
- Create Default Notification Payload Template is only available when the Observability Commons plugin is installed prior to installation.
- In the advanced settings there is a property to define which Dynatrace service types to ingest. This property includes 3 service types out of the box: CUSTOM_SERVICE, DATABASE_SERVICE, and WEB_SERVICE. This property helps filter down the Dynatrace services that get ingested into the CMDB. A customer may want to change this property to ingest service types that they are interested in.
- Clean Up Records from Previous Integration is only necessary if migrating from the 1st generation Service Graph Connector for Dynatrace application
Data Sources
Each data source is responsible for bringing in specific data from the Dynatrace environment into the CMDB.
- SGO-Dynatrace Hosts
-
- Contains computer data
- Ingests host data from Dynatrace
- Targets cmdb_ci_computer (and subclasses) in the CMDB
- SGO-Dynatrace Processes
-
- Contains running process data
- Ingests process data from Dynatrace
- Targets cmdb_ci_appl (and subclasses) in the CMDB
- SGO-Dynatrace Process Groups
-
- Contains group of like running processes
- Ingests process group data from Dynatrace
- Targets cmdb_ci_group in the CMDB
- Dynatrace doesn’t have the concept of “clustering”. Leveraging the process groups we can create groups of like processes in a service map to better visualize clusters of applications
- SGO-Dynatrace Services
-
- Contains a variety of information related to services that can be detected via the Dynatrace agent
- Ingests service data from Dynatrace
- Targets cmdb_ci_service_calculated in the CMDB
- Can be filtered using advanced settings properties
- SGO-Dynatrace Applications
-
- Contains information around manually defined applications
- Ingests application data from Dynatrace
- Targets cmdb_ci_service_calculated in the CMDB
- Applications are parents to services. These generally represent a higher level, logical group of services
- SGO-Dynatrace Application Relationships
-
- Returns the same data as SGO-Dynatrace Services
- Ingests application relationships from Dynatrace
- Targets cmdb_rel_ci in the CMDB
- This data source draws relationships between applications to processes that may have been skipped because services were filtered out
Service Maps
The service maps are created by the calculated application service. The top-down flow of the service map is as follows:
Application/Service
East/West Service Relationships if applicable
Process Group
Process
Host
After the integration runs, there is a script to calculate the impact values for processes that are part of a process group. This is done so that 1 process will not affect the status of the service if it is part of a larger process group. This calculation can be overwritten by default values if there are changes to the topology of the service map outside of the Dynatrace integration. The calculation uses the percentage of an application cluster's nodes that need to be in a state in order to raise that state to its parent in the service map within the advanced settings to calculate the impact value.
The operational status is originally set to Operational but may be set to Non-Operational via the business rule Change to operational status.
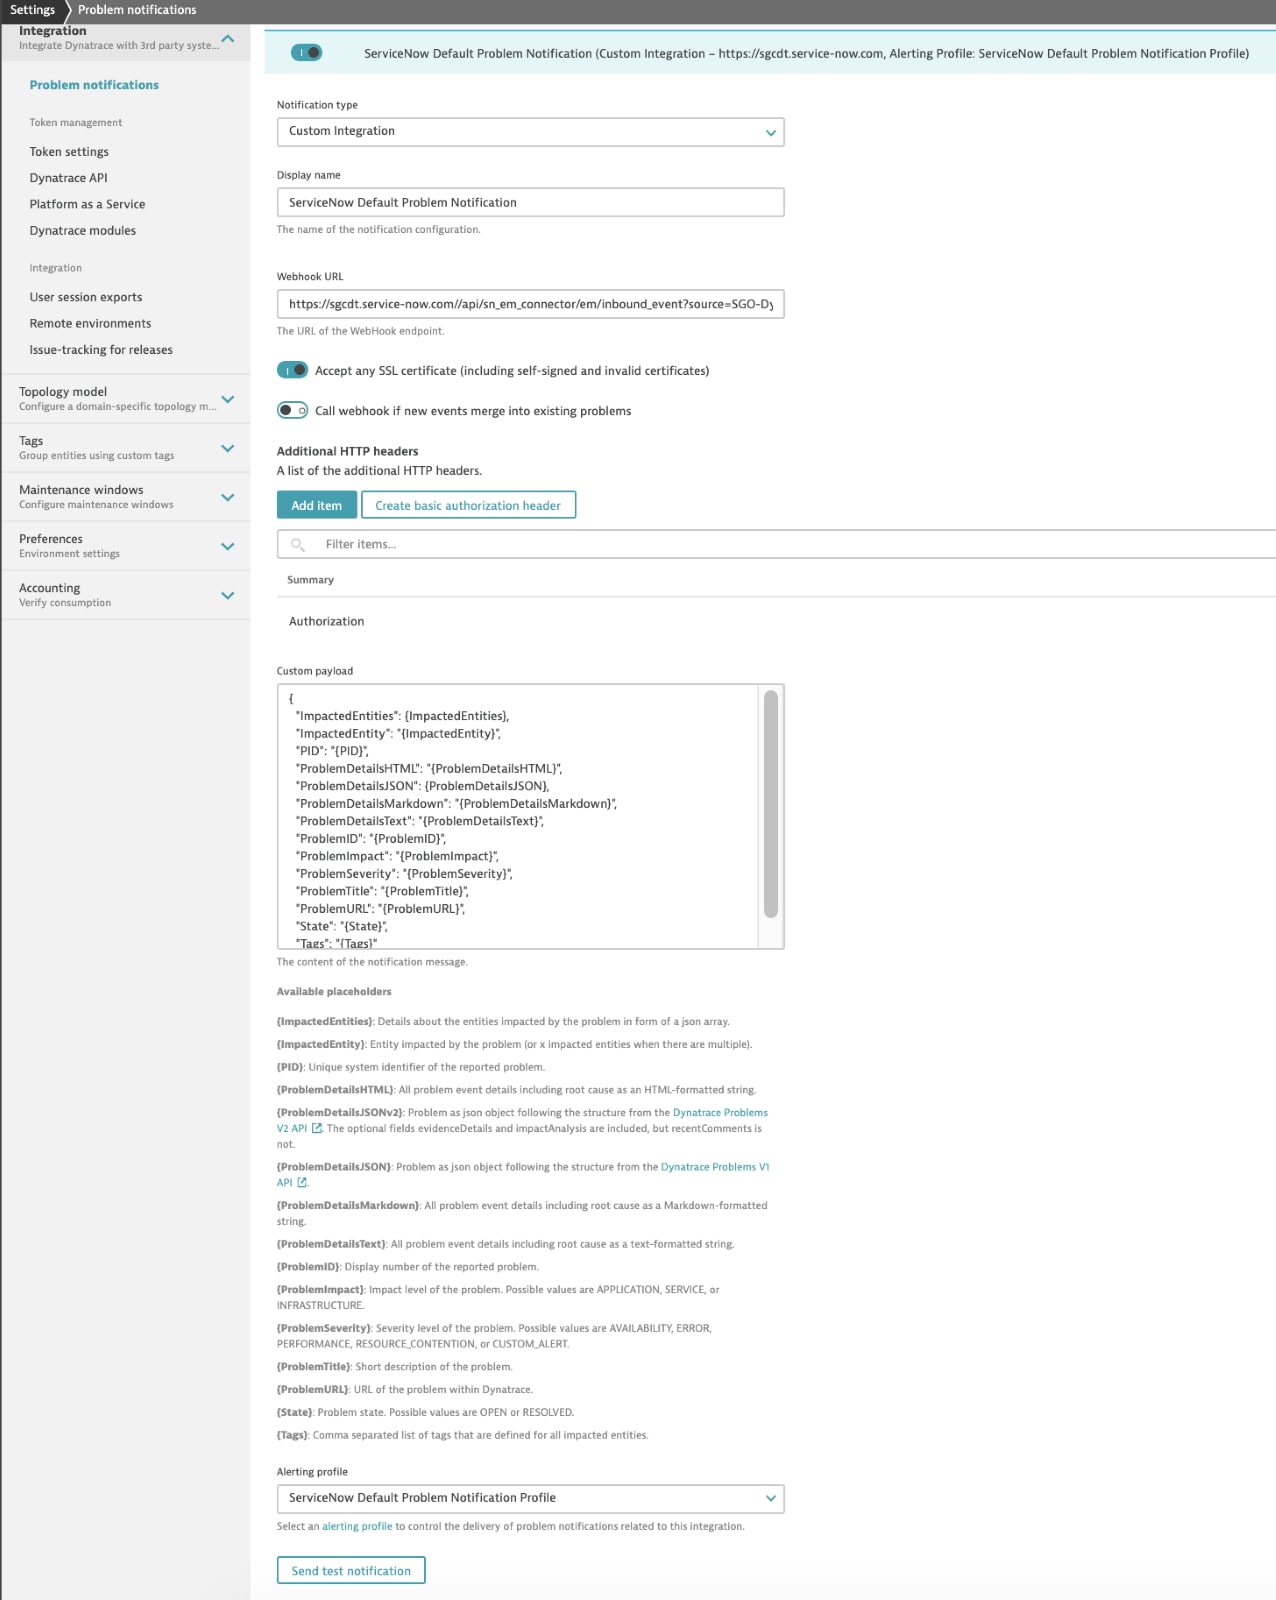
Event Management
During the guided setup of the Service Graph Connector for Observability Dynatrace there is a step to Create Default Notification Payload Template. This step has a button called Problem Notification Setup that when clicked will execute multiple API calls to Dynatrace to setup event ingestion. During this process the DynatraceAPI user will have a new secure password generated for it that Dynatrace will use to connect back to the ServiceNow instance.
This will create the following in the Dynatrace environment:
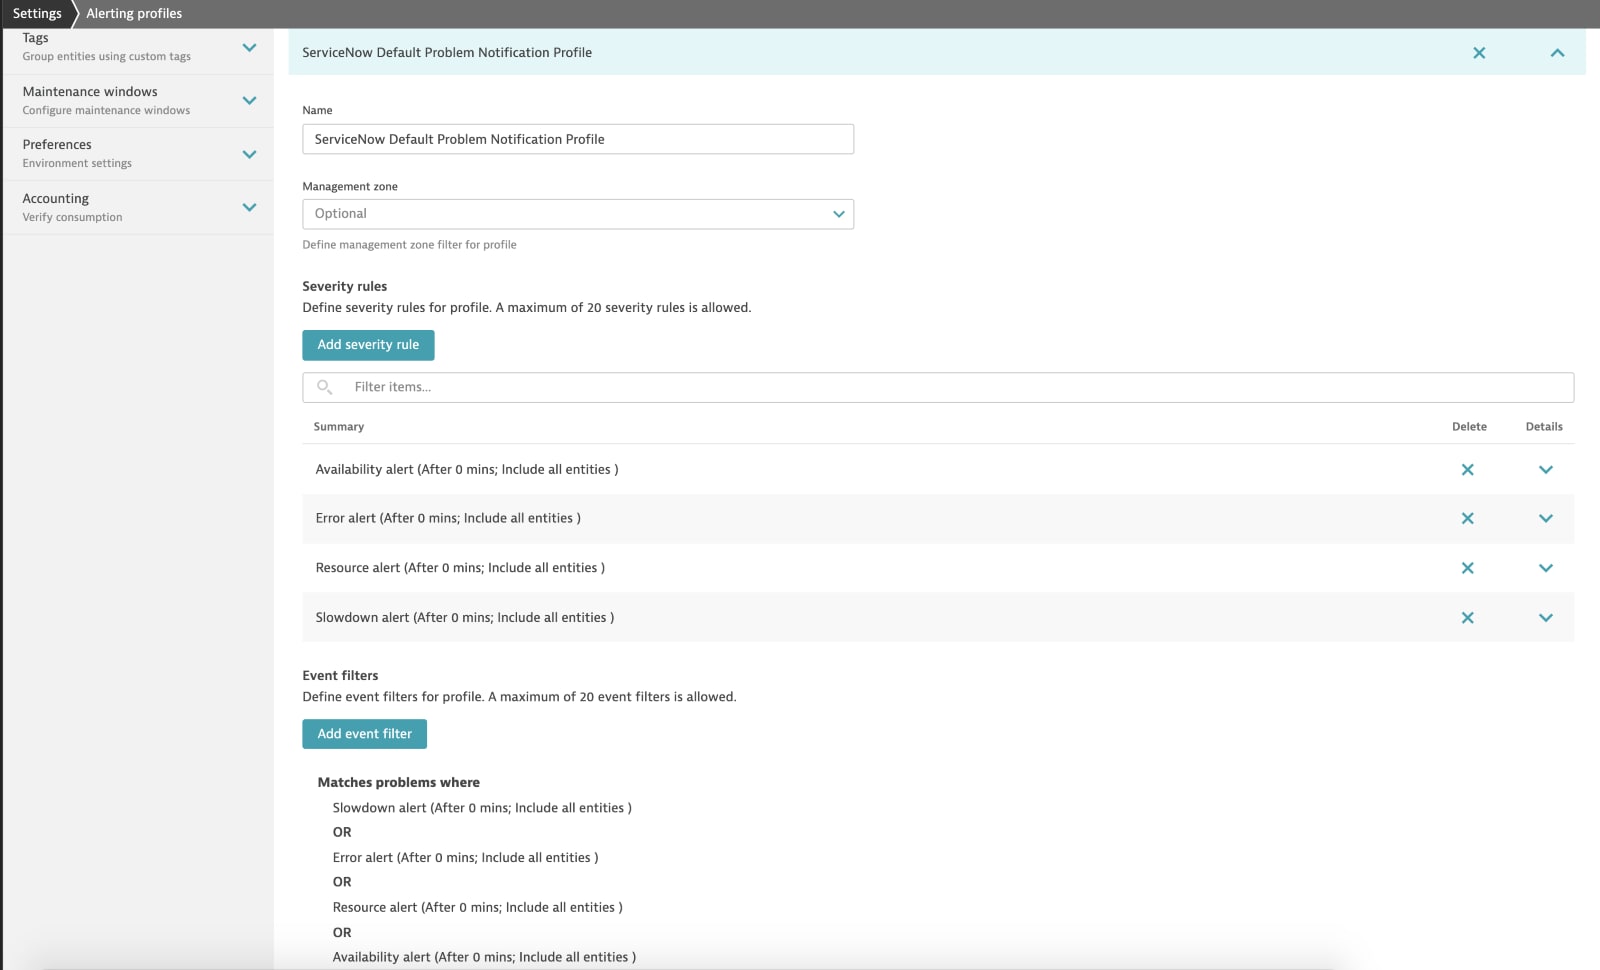
- Problem Notification
- Alerting Profile
A user can modify these records in the Dynatrace application if they need further fine tuning.
Notifications will then be sent from Dynatrace to the EM-Connector Inbound Event API. This API will pass the information to the Push Connector (sn_em_connector_listener) defined by this integration to parse the notification and create an event if there is a corresponding CI in the CMDB. From there, standard event management deduplication and alert creation are followed.
Once an alert is created, the Alert Management Rule is executed. This will call the associated subflows for further processing of the alert.
Metric Ingestion
Just in time metric collection is possible if the ServiceNow instance has MetricBase installed and configured.
Once an alert comes in that is associated to a computer CI, the SGO-Dynatrace Alert Subflow is kicked off that will then query the sn_dynatrace_integ_event_mapping table and the Dynatrace API for that CI and determine if any metrics are associated to that alert and CI. The metric will then fetch data in minute increments for the hour prior to the alert and save it in the sn_observability_metrics table.
Log Ingestion
Just in time log collection is possible. This requires the alert is bound to a computer CI and that Dynatrace is storing logs off that CI.
Once an alert comes in that is associated to a computer CI, the SGO-Dynatrace Alert Subflow is kicked off that will query the Dynatrace API to determine if logs are stored on that CI. It will then iterate through each stored log and return the last 10k log messages and save them to the alert as an attachment.
ATF Tests
The Service Graph Connector for Observability Dynatrace integration ships with a set of OOTB ATF Tests. These can be run by running the test suite SGO-Dynatrace Integration Tests. These tests will put example records into the import set tables, running the transformer, and verifying the output. These tests can be helpful in debugging issues and verifying the environment is set up correctly in order to process the data.
Demo Data
If the admin selects Load Demo Data during installation, then demo data records will be put into the CMDB. These records may be found by navigating to the cmdb_ci table and filtering by discovery_source = SGO-Dynatrace. These records may be helpful to see the output of the integration without setting up the connection. Service Maps may need to be recomputed in order to view the service map after loading the demo data.
Labels:
- 17,127 Views
10 Comments
You must be a registered user to add a comment. If you've already registered, sign in. Otherwise, register and sign in.
