- Mark as New
- Bookmark
- Subscribe
- Mute
- Subscribe to RSS Feed
- Permalink
- Report Inappropriate Content
11-29-2018 10:59 PM
Hi Team,
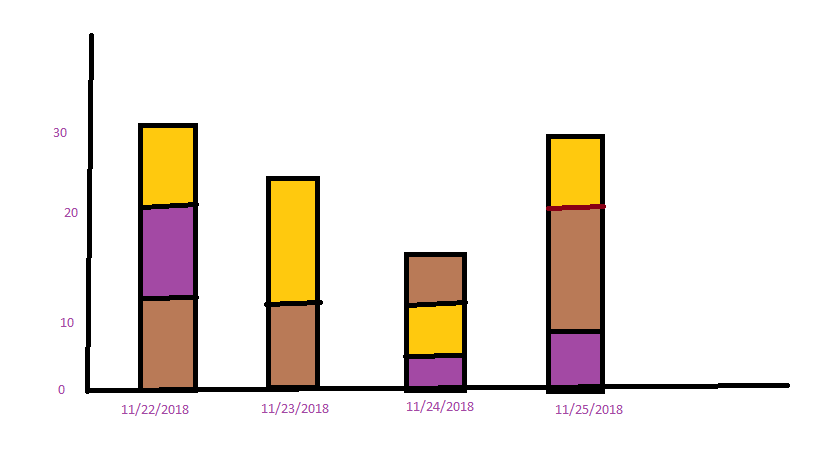
I want to change the X-Axis Time display on the report graph below. I want to display the data in Weekly or Monthly buckets. Not the default that Service Now is displaying.

For Example:
I want to display the data based on This Week by Date at X-axis as mentioned below.

Can you please anyone help this?
By,
Meena R
Solved! Go to Solution.
- 7,290 Views
- Mark as New
- Bookmark
- Subscribe
- Mute
- Subscribe to RSS Feed
- Permalink
- Report Inappropriate Content
11-29-2018 11:09 PM
- Mark as New
- Bookmark
- Subscribe
- Mute
- Subscribe to RSS Feed
- Permalink
- Report Inappropriate Content
11-29-2018 11:09 PM
Hi,
Please refer below link,
- Mark as New
- Bookmark
- Subscribe
- Mute
- Subscribe to RSS Feed
- Permalink
- Report Inappropriate Content
11-30-2018 04:13 AM
thank you Shweta,
That Link is Helpful....
- Mark as New
- Bookmark
- Subscribe
- Mute
- Subscribe to RSS Feed
- Permalink
- Report Inappropriate Content
12-07-2021 12:12 PM
Hey! I am facing the similar issue where I have to group the x-axis in reports by months. Could you please tell if you were able to resolve your issue and how?