- Mark as New
- Bookmark
- Subscribe
- Mute
- Subscribe to RSS Feed
- Permalink
- Report Inappropriate Content
09-15-2017 03:58 AM
I have created a report using the high chart API . i want to create a hyper link to the reports generated.
As we can see in out of box functionalities in service-now in reporting ,the same functionality is needed in high chart as well.
Solved! Go to Solution.
- Labels:
-
Analytics and Reports
- Mark as New
- Bookmark
- Subscribe
- Mute
- Subscribe to RSS Feed
- Permalink
- Report Inappropriate Content
09-15-2017 07:10 AM
Hi Amarjeet,
If I understand correctly, this JS Fiddle shows a great example of providing clickable URL's through the HighChart API and here's the HighChart API Reference. This gist of it is that you need to use the click event's object in your chart configuration which looks something like the following:
{
...
       plotOptions: {
               series: {
                       point: {
                               click: function () { location.href = 'url here'; }
                       }
               }
       }
...
}
- Mark as New
- Bookmark
- Subscribe
- Mute
- Subscribe to RSS Feed
- Permalink
- Report Inappropriate Content
09-19-2017 03:35 PM

- Mark as New
- Bookmark
- Subscribe
- Mute
- Subscribe to RSS Feed
- Permalink
- Report Inappropriate Content
09-20-2017 03:05 AM

- Mark as New
- Bookmark
- Subscribe
- Mute
- Subscribe to RSS Feed
- Permalink
- Report Inappropriate Content
09-20-2017 06:58 AM
Using a line and a bar for the same data (rather than overlaying two different sets of data) isn't as common, but we can do it.
Here's the steps:
1) Create a new report of the type 'Chart', and select Timeline.
2) For this report, group it by month (and filter as desired), but don't group it by Tower yet.
3) Click on the word 'Count' in the Value fields, click the pencil icon, and relabel it to be 'Total Incidents'.
Right now, you should have a report that looks like this:

4) Go to File > Make a Copy.
5) In the new report, add the Secondary Category for Tower
6) Click on the word 'Total Incidents' in the Value fields, click the pencil icon, and relabel it to 'Breakdown'.
Your report should look like this (my data doesn't have a 'tower' field so I'm using 'category'):

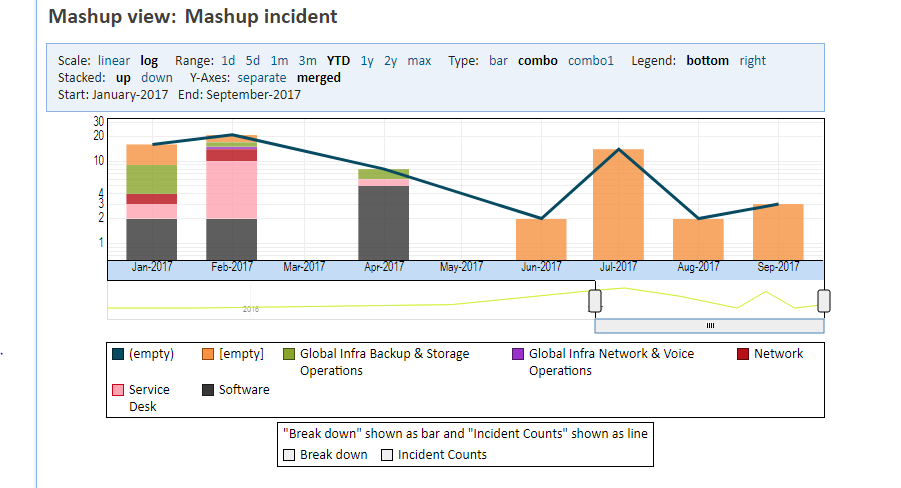
7) Go to File > New mashup view
😎 Select the two reports you just made in the Input View names:
9) In the resulting chart, look at the top of the report and select Type: Combo and Y-Axes: Merged:

You will now have a Bar and Line chart for your data.
- Mark as New
- Bookmark
- Subscribe
- Mute
- Subscribe to RSS Feed
- Permalink
- Report Inappropriate Content
09-21-2017 01:57 AM
