Is it possible to filter a list by clicking an adjacent Data Visualization, without hard coding?
- Mark as New
- Bookmark
- Subscribe
- Mute
- Subscribe to RSS Feed
- Permalink
- Report Inappropriate Content
04-29-2022 02:49 PM
For my Device records I have two audiences: Admins, and Site users. Admins see all records. Site users see only records for one site (for example, site X).
I have an Admin page, and several Site pages. The Admin page is for the admin user and shows all records. Each site page shows only records for one site. (I thought of implementing the Site pages as variants of the Admin page, but deferred implementating it that way for various reasons.)
The Admin page has a list showing devices across all sites. But I also want the admin user to be able to, so to speak, zoom in on a particular site, and I want to make it very easy for them to zoom in (meaning, look only at records for site A, or optionally, filter out records for site A) and zoom back out (view all records).
Of course I could do that by providing the admins user with a link to the Site_a page, and the site_b page and so on. But that would be a dumb and cluttered way to do it.
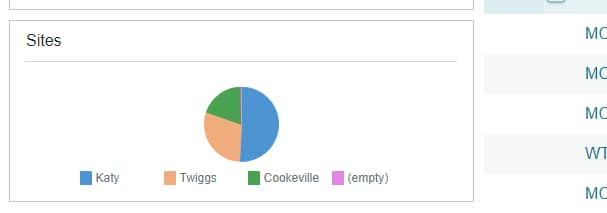
So I thought of putting another visualization, such as a pie chart, on the page, where the devices are grouped by site, the idea begin that by clicking on a site they could filter the list down to only records for that site, and clicking again, remove that filter, and so switch back to seeing all devices.

I'm familiar with the Open Lists from a Data Visualization exercise in the Events in UI Builder course. That example is hard coded, and won't work for what I'm trying to do.
It's clear this calls for setting up some boolean client state variables (site_a, site_b, site_c) and setting these to true, and deriving the list filter from from these. But I don't understand how I can use a client script to read the payload from the sole event (Visualization clicked) to determine what the user just clicked on.
Or is that even the right question? Can I get the data I need -- has the user clicked on a wedge and if so which one? -- in a client script by reading the properties of the visualization? How can I, so to speak, debug these values so I can see what I'm working with?
- Mark as New
- Bookmark
- Subscribe
- Mute
- Subscribe to RSS Feed
- Permalink
- Report Inappropriate Content
04-30-2022 11:19 AM
I think what you may need is Interactive filters- where you have things like widgets containing states, dates, choice values and references that you can change and the data reflected in the reports change dynamically.
- Mark as New
- Bookmark
- Subscribe
- Mute
- Subscribe to RSS Feed
- Permalink
- Report Inappropriate Content
05-10-2022 01:58 PM
Here is how to do it:
First add a client state variable siteName to capture the site the user wants to drill down to. If this variable is null or empty, the user is not drilling down.
Next, add another String variable named listRefresh. Fill this in as the refresh requested property on your list. When this variable changes, the list will refresh.

Next, call a client script from the Visualization Clicked event.

The client script will receive a payload something like this:
{
"title": "Device Count by Site",
"params": {
"listTitle": "Device Count by Site",
"table": "x_xxxx_rf_poc_device",
"query": "u_status!=retired^ORDERBYDESC$AGGREGATE$^u_site.u_name=Cookeville",
"workspaceConfigId": "",
...
}
Pick out the site name and set your client state variables. If the new value matches the existing, meaning the user clicked the same wedge again, unset the value.

var filter = "";
var dirty = false;
...
// (Optional) filter by site
if (true && api.state.siteName /* not null, not empty */ ) {
filter += dirty ? "^" : "";
filter += "u_site.u_name=" + api.state.siteName;
dirty = true;
}
return filter;
}