Report - multiple lines/trends?
- Mark as New
- Bookmark
- Subscribe
- Mute
- Subscribe to RSS Feed
- Permalink
- Report Inappropriate Content
03-30-2021 07:58 AM

- Mark as New
- Bookmark
- Subscribe
- Mute
- Subscribe to RSS Feed
- Permalink
- Report Inappropriate Content
03-30-2021 08:26 AM
Yes, Out of Box you can have aggregate charts.
If you want time based/trend based data, you would require Performance Analytics for whichever module you are looking at. In this case, I assume PA for HRSD, which is a separate paid subscription.
More info for PA can be found at https://www.servicenow.com/products/performance-analytics.html
- Mark as New
- Bookmark
- Subscribe
- Mute
- Subscribe to RSS Feed
- Permalink
- Report Inappropriate Content
02-28-2023 04:30 PM
It is indeed possible to get trend lines(even if you dont have perf analytics). All you have to do is use a dataset and you can add multiple trend lines to the same report.
Note: you will need to create a dataset per report.

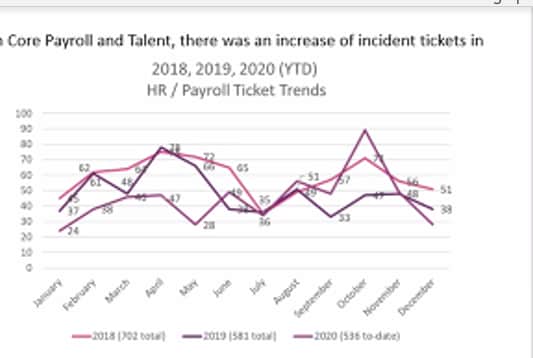
Final Report:

here is a video by Goran which explains the process of adding a dataset and multiple trends in a report. You can start from the 8 min marker:
https://youtu.be/SQACTGJJoTE?t=495
Please let me know if you have any questions. Mark this helpful if found this helpful so that others can also find it useful.