- Mark as New
- Bookmark
- Subscribe
- Mute
- Subscribe to RSS Feed
- Permalink
- Report Inappropriate Content
11-18-2019 08:12 AM
Hey SN Comm!
I am looking to see if I can create a report on the HR Case Table - specifically, I need to know if I can do the following:
- How many Cases were assigned out in the day (today), by rep
So, the report needs to show cases that were assigned today to someone.
Is this possible?
Thanks,
-Rob
Solved! Go to Solution.
- Mark as New
- Bookmark
- Subscribe
- Mute
- Subscribe to RSS Feed
- Permalink
- Report Inappropriate Content
11-19-2019 09:28 AM
Rob, so far you created a metric based on the assigned to person. If you want to look at it by group, a metric on the assignment group would be needed. The same database view should help you.
Also this lab on the developer portal may help you better understand metric reporting. Of course it is based on Incident, but incident also extends task just like HR Case:
- Mark as New
- Bookmark
- Subscribe
- Mute
- Subscribe to RSS Feed
- Permalink
- Report Inappropriate Content
11-18-2019 08:46 AM
"Reporting on a metric is done using the database view that links the metric to the table on which it is defined."
Yep - I see that hahaha!
Reading more!
-Rob
- Mark as New
- Bookmark
- Subscribe
- Mute
- Subscribe to RSS Feed
- Permalink
- Report Inappropriate Content
11-18-2019 09:01 AM
So, I created the metric - went through where it says how to report off a metric (https://docs.servicenow.com/bundle/newyork-platform-administration/page/use/reporting/concept/c_DatabaseViews.html#c_DatabaseViews)
Created the database view - but still do not understand how I can create a report showing what I need.
Are you able to help there?
Thanks,
-Rob
- Mark as New
- Bookmark
- Subscribe
- Mute
- Subscribe to RSS Feed
- Permalink
- Report Inappropriate Content
11-18-2019 09:06 AM
I basically cheat my way into this. I go to the Metric Definition & the related list of metrics under it. Then, I copy that URL (from the Metrics breadcrumbs) and paste it into a new browser window. From that new window, click any column header & select Bar Chart to create the report. Edit as needed.
- Mark as New
- Bookmark
- Subscribe
- Mute
- Subscribe to RSS Feed
- Permalink
- Report Inappropriate Content
11-18-2019 11:26 AM
Okay - I was able to do this, and get to a certain point. First, on a couple of the columns allowed me to select the Bar Chart to create the report. Next, I am able to show the name of the Assigned To person by using the Value for my selection. And it looks like this:

Are you able to extend your help? Is there a way from what I created to get this far, to where I can make it look at a certain group as well? From my editing options, that is not one of them.
Here is my metric:

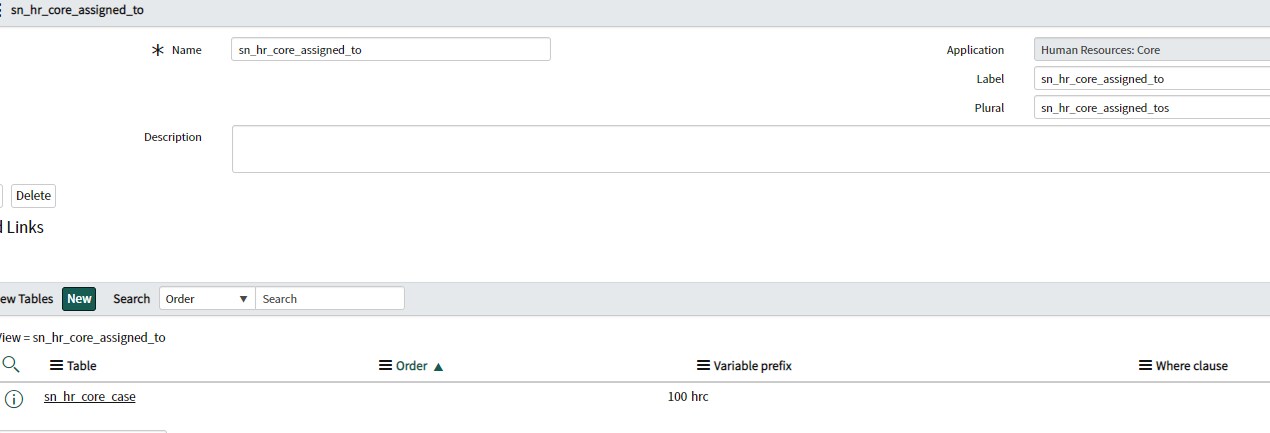
my database view:

Then from the view tables:

(Group I just added now to see if anything would change).
Thank you in advance if you know if this can be accomplished or not. And if you see any errors on my part.
-Rob
- Mark as New
- Bookmark
- Subscribe
- Mute
- Subscribe to RSS Feed
- Permalink
- Report Inappropriate Content
11-18-2019 12:37 PM
Okay - I think I can get away with making it so the 'value' field is each name from a specific group (good thing the group I am doing this for is small). However, if you have a way of letting me know from my last reply to you, that would be great!
Cheers!
-Rob