


Callan Bond

ServiceNow Employee
Options
- Subscribe to RSS Feed
- Mark as New
- Mark as Read
- Bookmark
- Subscribe
- Printer Friendly Page
- Report Inappropriate Content
04-10-2019
02:48 PM
So your Service Mapping implementation is complete, and you've created a number of shiny new service maps. Congratulations! You've worked hard to make sure the maps are accurate and that they'll be getting updated automatically. But if those service maps aren't used in your daily operations, you really haven't gained anything.
A service map isn't a collectible toy action figure that needs to be kept on the shelf in its pristine packaging: it's meant to be taken down, opened up, and played with. Or, at least, used for your Incident Management, Change Management, and other key daily activities. These activities should 'feel different': you should be able to get Incidents to the right teams faster, and your Change planning should get all the right parties involved.
This blog entry covers use cases for your service maps and some suggestions on how to best make use of them on a regular basis. The embedded video below also covers these topics:
Terminology
Let's start by making sure we're all on the same page. Here is some common Service Mapping terminology:
- An Application Service is an offering that is delivered to customers
- Performs a single or a few limited specialized operations.
- Also referred to as simply a service or application
- Can be comprised of a simple application, or an instance of an application (e.g., Wire Transfer application Europe, Wire Transfer application North America)
- Technology Services are not customer-facing, but are separate ‘behind the scenes’ components which support application services. They may also be referred to as supporting or shared services.
- A Configuration Item is a unique, fundamental element of the CMDB. It is the “what” of a Change in an environment.
- A Cluster (in Service Mapping terminology) is a logical grouping of CIs
Implementation Path
Before we go to far into how to use service maps, let's take a very high-level look at the best way to get to having a number of useful service maps created:
First, you need to have your CMDB populated before implementing Service Mapping. There are a number of ways to get this done, but one of the best is to use ServiceNow Discovery. Discovery integrates seamlessly with the CMDB, and gets more attributes per CI than many other methods. That said, Discovery isn't certainly the only way to populate a CMDB, and often is used in conjunction with other tools such as Microsoft SCCM and others.
You should run the CMDB Health Scorecard to get an idea of the health of your CMDB, and rectify major problem areas where you can. There's an excellent blog posting already in Community on using the Health Scorecard, and if you haven't already dived into this useful tool you really should.
Lastly, as you identify which services to map, you should focus on services that meet one or more of the following criteria:
- Have a high business value to your organization
- Have had repeated service outages over the last 6-12 months
- Are similar to each other (i.e., they leverage similar infrastructure). Mapping new services that are similar to ones that are already mapped is easier.
Use Cases
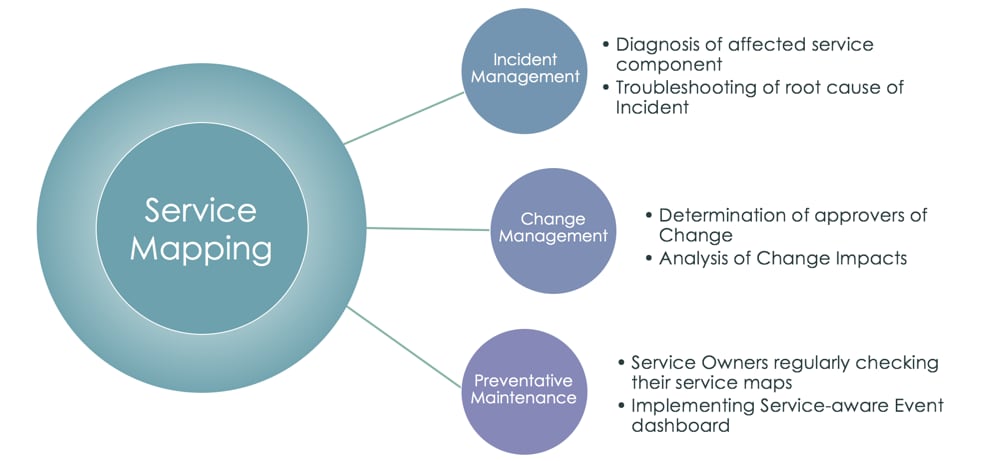
There are many ways to leverage the maps you have created. Following are three of the common use cases that drive a lot of the value of implementing service mapping in the first place, and are what we see many of our successful customers do:
Incident Management
Improving your MTTR (Mean Time to Resolution) for your major incidents is one of the primary uses for having services mapped. Understanding the relationships between all of the CIs that make up a service, and easily seeing recent Incidents and Changes on those CIs, provides invaluable insight in both ensuring the Incident is routed to the right team quickly, and in troubleshooting an active issue.
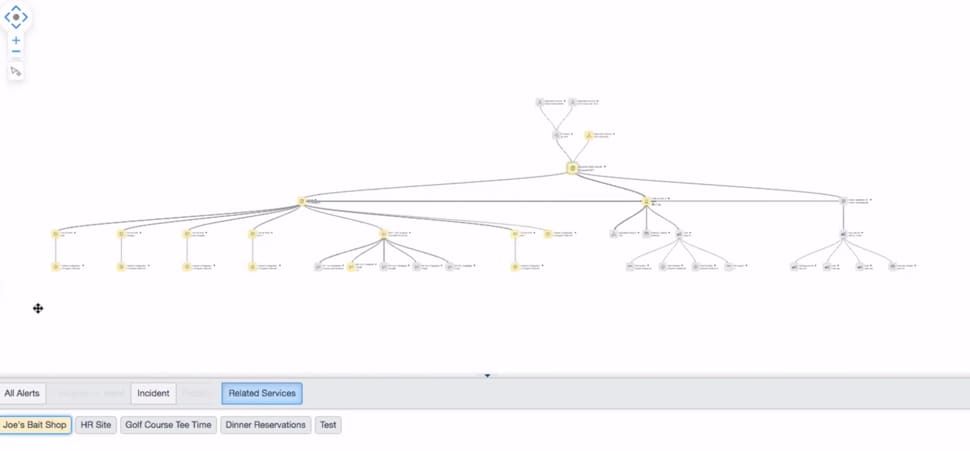
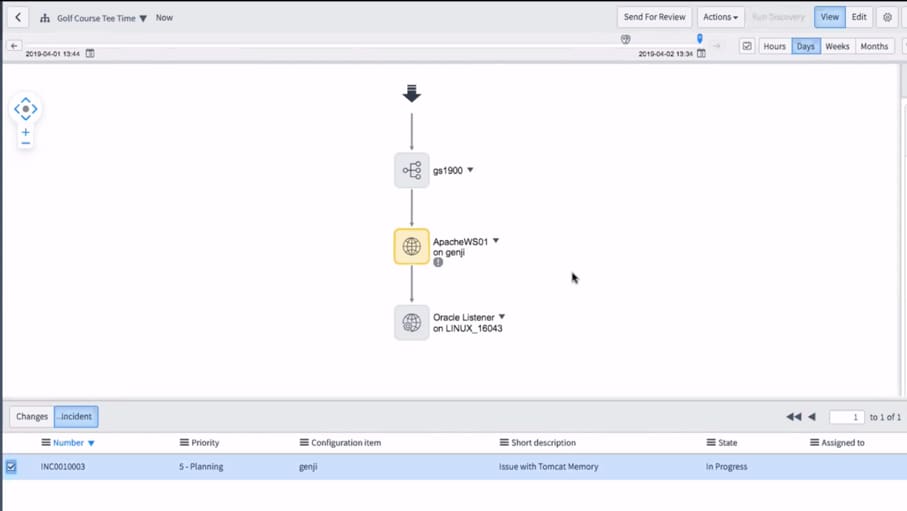
For routing, let's take a very simplified example. An end user calls in to the service desk and says the Golf Course Tee Time application isn't responding. The service desk could route the call to the application team itself, but in a large or complex application service, this could be comprised of dozens or hundreds of discrete parts. Is it a database issue? Application server? Network? Storage?
Avoiding the 'all hands on deck' scramble of a major incident, a service map lets a front-line responder easily see what components have recently (or currently) have Incidents associated with them. In this (again, very simple case), the Apache server shows an Incident already in progress, so the service desk can associate this new call to the current master Incident, and also let the customer know that the right team is already aware of the issue
For troubleshooting, let's take an unfortunate real-life example. A critical document management system goes down on Christmas Eve. There is an 'all hands on deck' scramble to find the source of the issue. Turkey is literally getting cold. What those on the all-hands call are not aware of, however, is that a well-meaning IT staff member applied a Change to the system the day before which caused the issue. If a service map were available at that time, the Change would have been spotted much more easily, and immediately an investigation could have started there to see if that was what caused the issue. Unfortunately in this case, a service map was not in place and over three hours of a special holiday were spent on the phone...
Change Management
Which brings us to Change Management. Many planned changes still cause unintended impacts. Why? Applications can be so complex, that the impact of patching one server or taking one database down are often not fully understood. A service map let's infrastructure teams more easily see the relationships and impacts of individual CIs, and CAB can then more fully assess the impact of changes and ensure that all of the right service owners are aware of what will be happening in their environments.
Preventative Maintenance
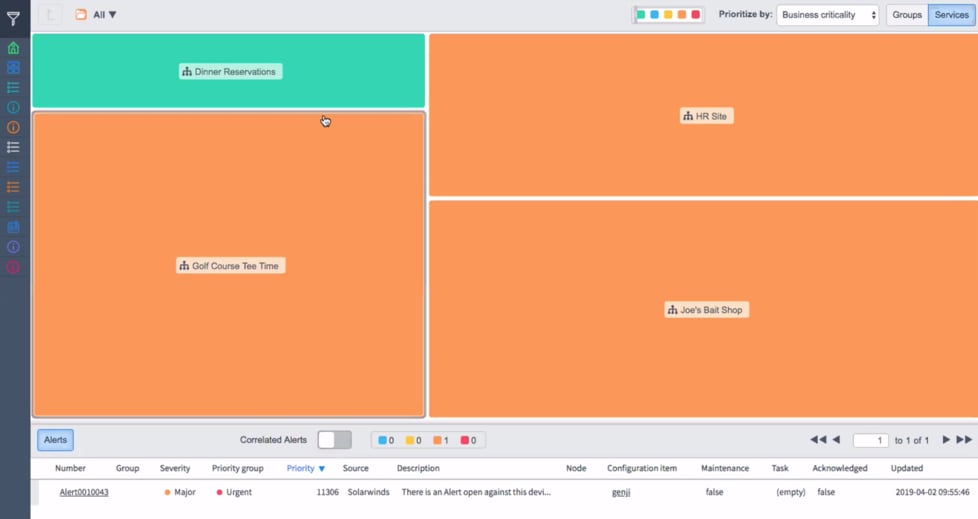
Another common use case for service maps are proactive checking and preventative maintenance. A service owner can check on the status of their applications more easily with service maps, and especially when combined with Event Management can view powerful dashboards that provide real-time views into service health.
In addition to the Event health dashboard, Event management-created alerts can go to the right service owner when they come in (rather than just the CI owner). Alerts that are tied into service maps can also be color coded to match the severity level, giving yet another easy way to quickly look at service health, and potentially have the right team address a performance degradation before it turns into an outage.
Key Performance Indicators
Lastly, let's look at how you can measure the effectiveness of your service maps. We will focus on three metrics: MTTR, Outages caused by Change, and Service Mapping Effort. In all of these cases, getting a baseline is important. Look at the last six months of data that you have for the three KPIs below, and although in some cases extra effort may be required to capture, it's important to be able to compare the 'before and after' of the effect of your service maps.
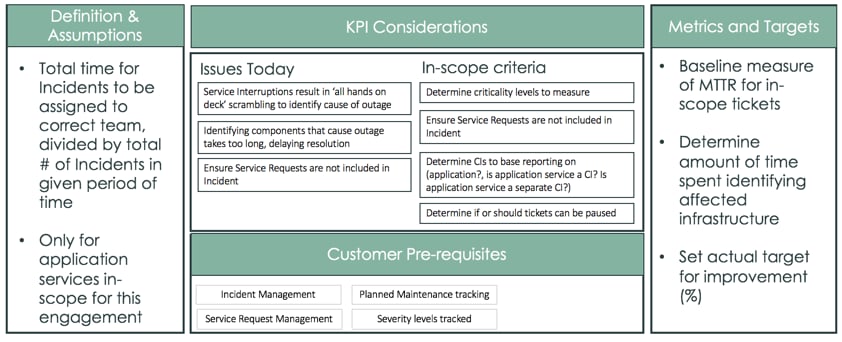
Mean Time to Resolution
This is actually a bit of a misnomer for service maps: while overall MTTR should decrease for services that are mapped, it mainly is the Mean Time to Diagnose that will see the most improvement. Going back to the Christmas Eve example above, for a complex service that is down, having an up-to-date service map makes it much easier to determine which component should be looked at first, and subsequently, which teams to route the Incident to. This can be captured by tracking time between Incident start, and assignment of the Incident to the team which ultimately closed the Incident successfully.
It's also important to scope these KPIS accordingly. Look at only High and Critical Incidents, as lower priority Incidents usually have other factors that can lead to longer resolution times. Of course, only look at Incidents for which you have service maps. And lastly, if you are also using Incident records to track service requests (or anything that is not a degradation or interruption to a service), make sure to exclude those.
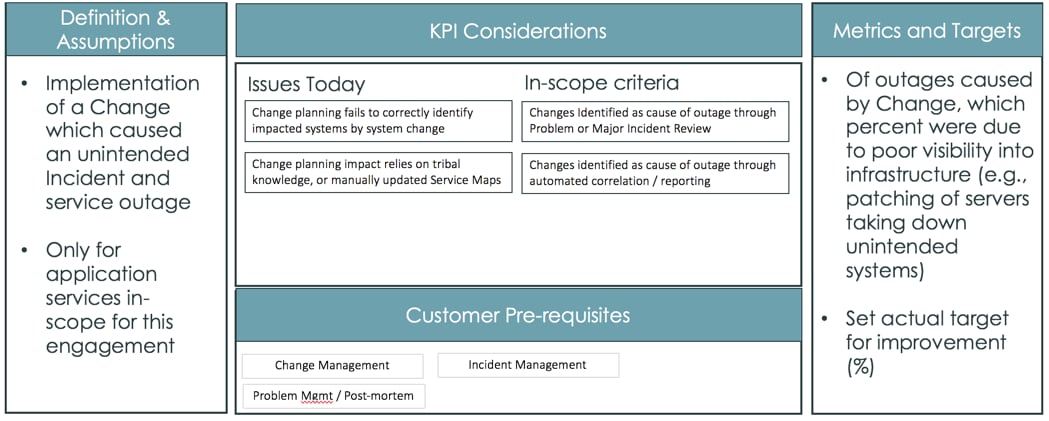
Changes caused by Outage
By having better Change planning, you should have less outages introduced as a result of planned Changes. Like MTTR above, scoping what you measure is key to ensuring your KPI is meaningful. In this case, understanding the cause of your major outages is key. In general, this understanding may come from a post-mortem or broader Problem investigation of the incidents after they close. Often teams that were involved in incidents caused by change are reluctant to make this connection, because it's more palatable to blame downtime on a failed hard drive rather than a planned change which didn't take into account the services that rely on that hardware. Identifying these outages over the prior six months, and then tracking new outages (again, only for services that are mapped), should show the effectiveness of service maps for the Change process.
Manual Mapping
Lastly, perhaps the most self-explaining KPI is that manual effort to map services should go down. Many companies with no or poorly implemented service mapping functionality ultimately rely on Visio or other diagrams (or even manually maintained connections within the ServiceNow CMDB) to understand the components of their service.
Having the people doing this mapping track their time is key to understanding and seeing improvement in this metric. Whether this is from time tracking or 'best guestimates', once you have the baseline numbers you should be able to see the improvement. Generally, the more service maps you have, the better this metric will be as the overhead required to maintain the service mapping application gets lower per-map, the more maps you have.
What If You Don't See Improvement?
So you've impemented the maps, had a Change communication plan to roll out the fact the maps are there and available for use, and you're not seeing the improvement you hoped? There could be a number of reasons, but one common culprit is that IT support teams aren't adopting the new process of referencing the maps, either in Incident or Change Management. Some IT support teams who have 'always done it this way': successfully supporting applications for years, can be reluctant or forgetful on referencing the service maps.
For Incident management, how you address this can depend on your company culture. One approach that has seen positive results is tracking MTTR (or MTTD) on a team-by-team basis, and rolling these into department-wide metrics. If a few teams see improvement, use these to showcase to other teams whose MTTR are not improving. Whether you privately meet with those support team leads to review how to use the maps, and show the KPI improvements of teams that are, or you decide to blast out the report to all of IT and let public knowledge of who is seeing improvement and who isn't provide motivation, is up to you.
For major outages, the post-mortem on Problem investigations often themselves can go into enough detail to highlight whether the appropriate people had visibility, awareness, and approval control of the changes that adversely impacted their services. Referencing service maps as part of the Change process, and even asking if they have been checked as part of standard CAB procedures, can be a solution here.
Hopefully the advice above has given you some guidance on getting the most of your service maps. With your service maps not only accurate, but in-use, you will ultimately see fewer major outages, and realize more of the benefit that your service maps have the potential to deliver.
Labels:
- 18,000 Views
1 Comment
You must be a registered user to add a comment. If you've already registered, sign in. Otherwise, register and sign in.

