


rumija
Kilo Explorer
Options
- Subscribe to RSS Feed
- Mark as New
- Mark as Read
- Bookmark
- Subscribe
- Printer Friendly Page
- Report Inappropriate Content
09-21-2015
08:47 AM
Suppose the SAML related plugin is activated and external authentication is enabled in SAML properties of your ServiceNow instance, if you are facing trouble while logging in to the instance using SAML, you may need some help to enable the SAML related debug properties to identify the errors. Activating SAML to debug in ServiceNow and ADFS 2.0 during set up of SSO can save you a ton of time in the case you receive errors. Once the debugging is enabled we can see the appropriate logs in the script logs statements. The logs will help you to point the exact error where the authentication failed while using SAML. Debugging early on can ensure that you are troubleshooting within scope of activating SAML and ADFS for SSO.
After SAML plugin activation and initial configuration, errors can appear that potentially generate P1 outages. We can refer to the SAML error matrix after we find the error from the debug logs on how to fix the corresponding issue.
How to enable SAML Debug in ServiceNow
Debugging in ServiceNow is enabled at the bottom of the SAML setting page. Incase you have already activated the SAML external authentication in your instance and you try to access the https:// < Instance-name > .service-now.com .you will be redirected to SAML login page. You have to use the below steps to login as ServiceNow local user id.
How to login as a local user:
- Access the instance using side_door.do
- https:// < Instance-name > .service-now.com/side_door.do
- Enter ServiceNow local userid and password to login to the instance.
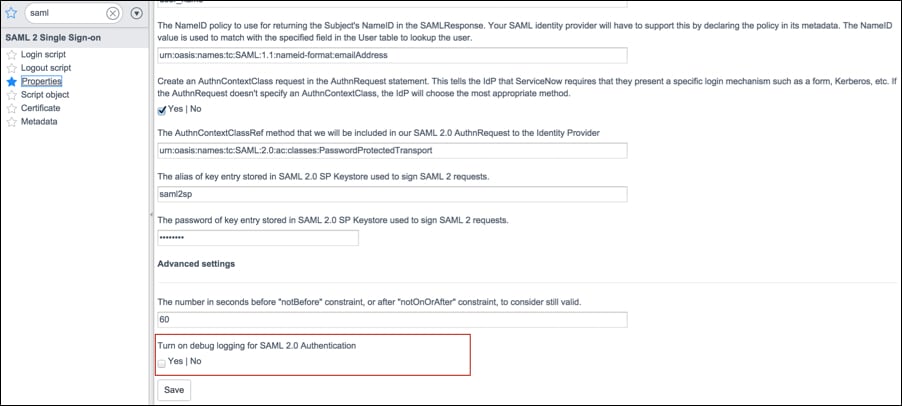
If SAML 2.0 Single Sign-On Update 1 Security Enhancement plugin is activated in your instance, Please navigate to SAML 2.0 Single Sign-On > Properties to enable the debug logs.
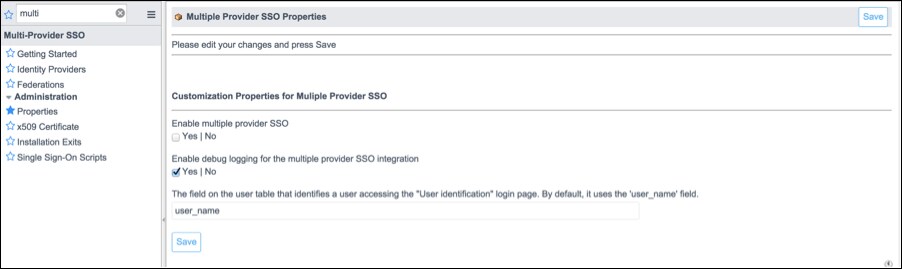
You can use the following steps to activate SSO related logs incase you are using Multi-Provider SSO.
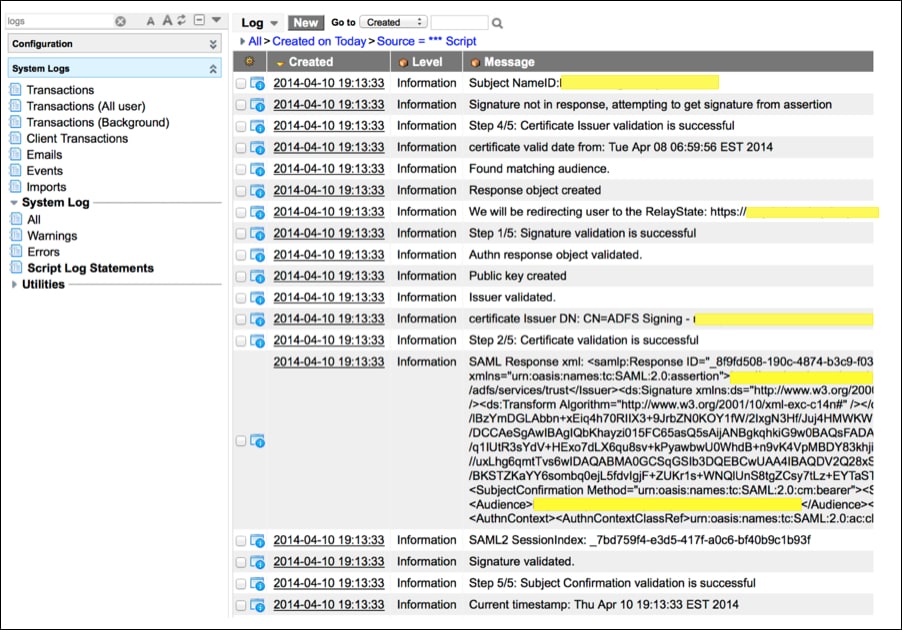
This will help to put log entries in the logs, which can be seen under System Logs > System Log > Script Log Statements.
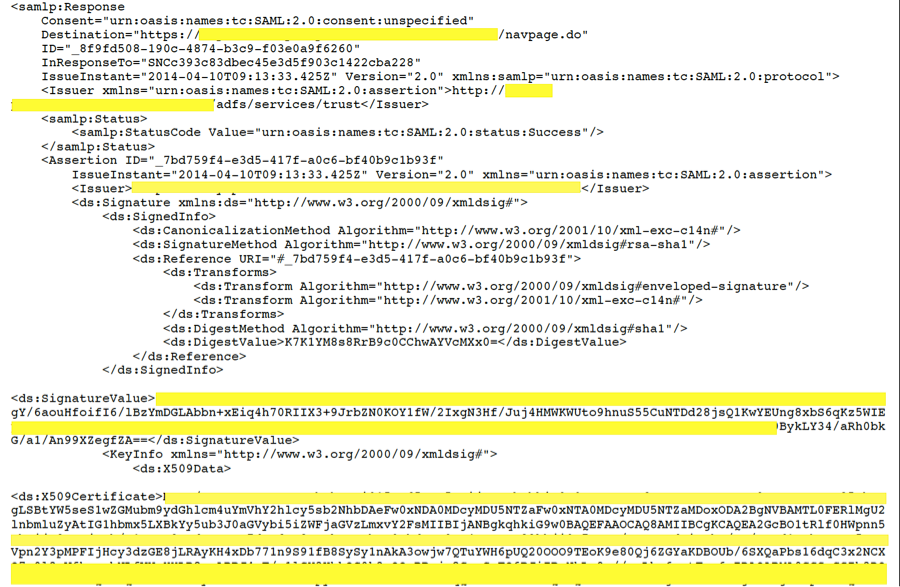
We can copy the logs which starts with "SAML Response xml:" in to XMLSpear tool or any convenient XML viewer to verify the value of different XML parameters.
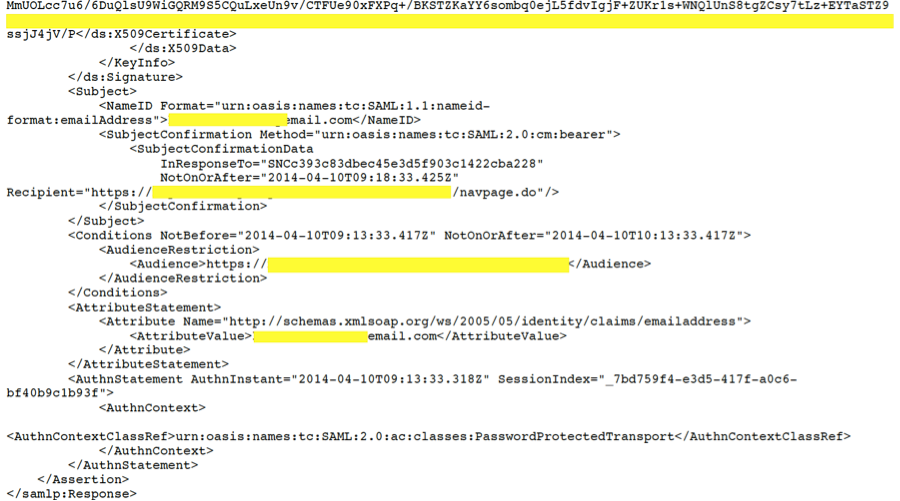
Here is an example of a SAML Response XML:
How to enable debugging in ADFS
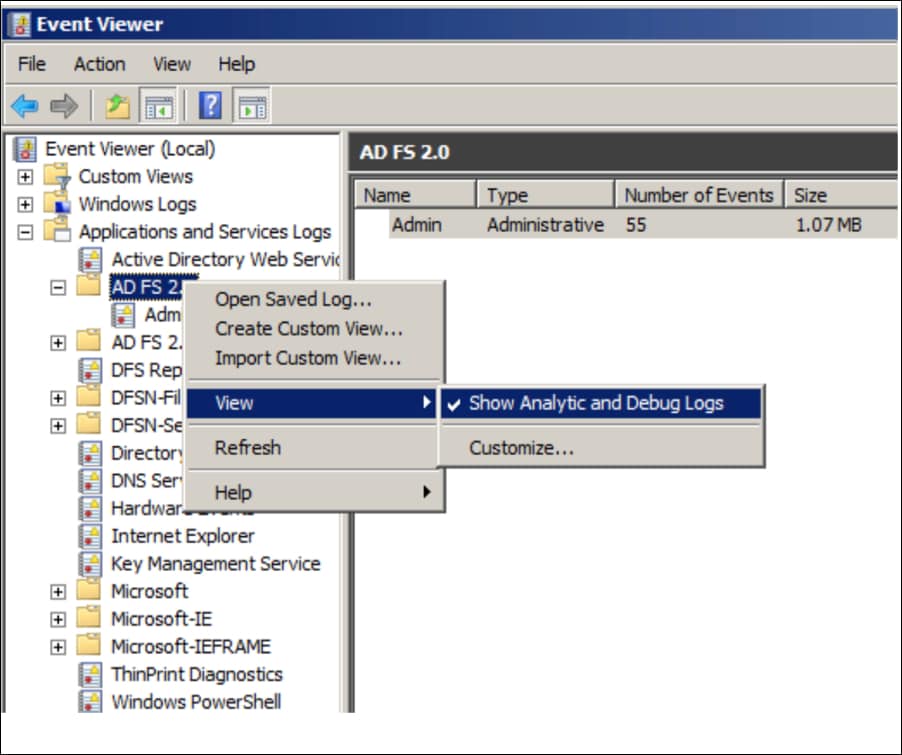
- Launch the Event Viewer and locate the ADFS 2.0 tab.
- Right click , select View
- Enable the Show Analytic and Debug Logs
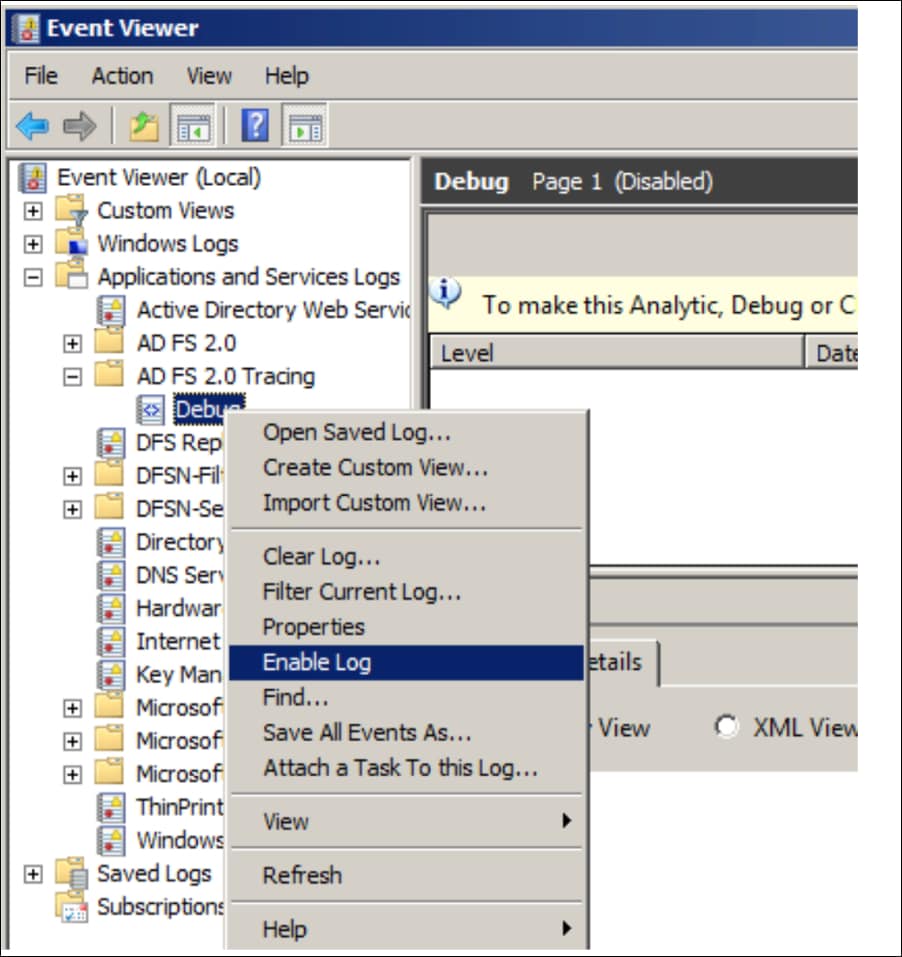
A new folder called ADFS 2.0 Tracing will appear. Expand the folder, Select Debug , right click and Enable Log.
Remember to turn off debug once the troubleshooting completes otherwise the system will keep generating additional SAML related logs which results in bigger log files. It won't take a toll on your instance's performance if you leave the debugger on; however, it is recommended to disable the SAML debug in order to avoid large log files. The logs in the Scripts log Statement may not be logged in sequence if the logs were generated in the same second.
Helpful SAML and ADFS 2.0 integration resources:
How to Configure ADFS 2.0 to Communicate with SAML 2.0
LDAP, SAML, SSO...an alphabet soup of acronyms you should know if you can't log in
You Don't Need a VPN Part III - Using Single Sign-On for Authentication
4 Comments
You must be a registered user to add a comment. If you've already registered, sign in. Otherwise, register and sign in.
