

Manjeet Singh

ServiceNow Employee
Options
- Subscribe to RSS Feed
- Mark as New
- Mark as Read
- Bookmark
- Subscribe
- Printer Friendly Page
- Report Inappropriate Content
11-27-2019
11:53 AM
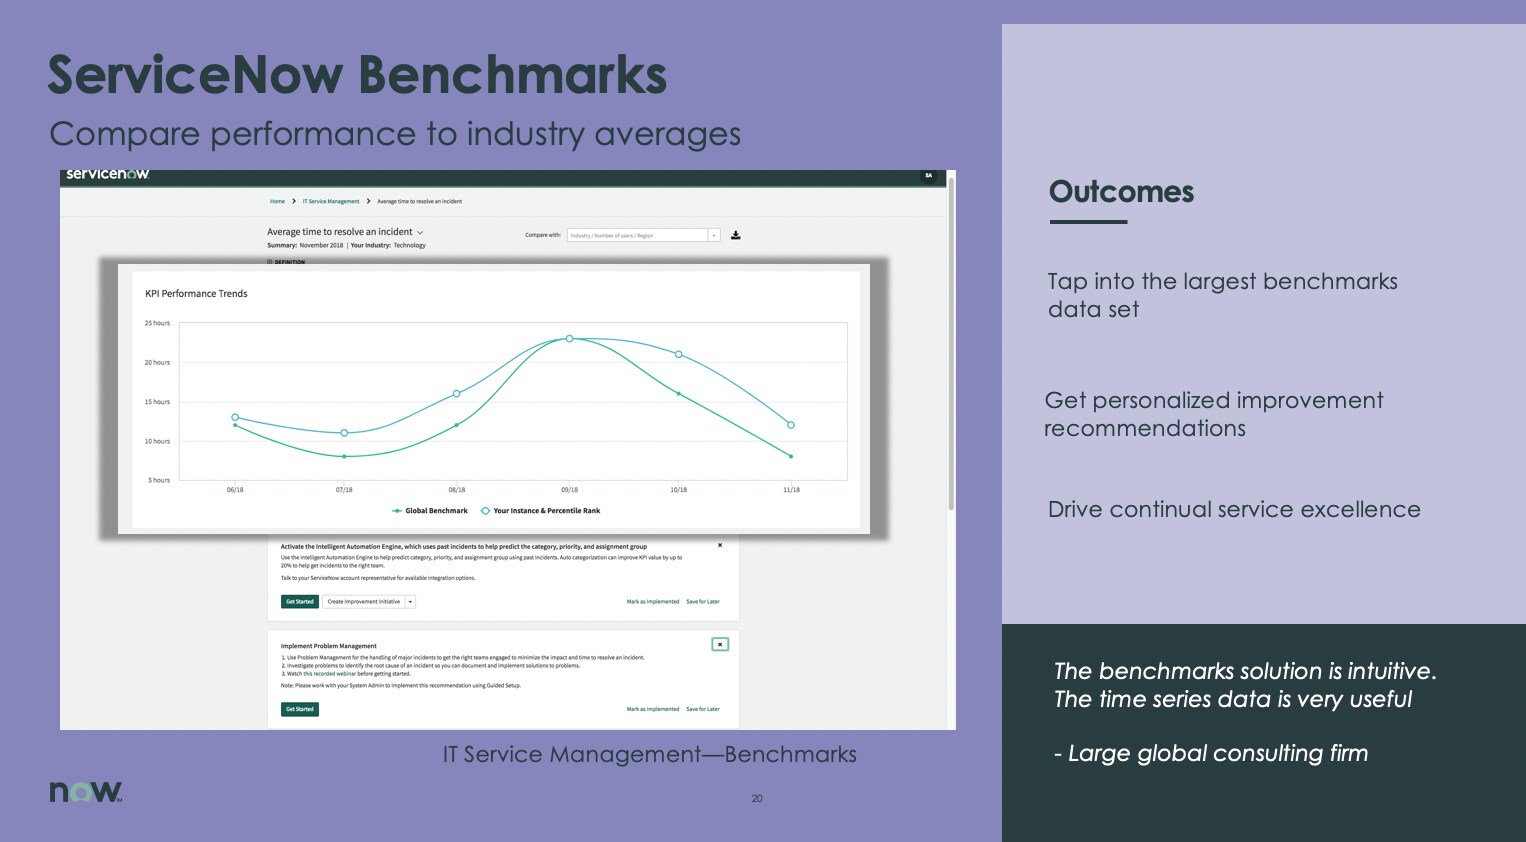
If 60% of your customers consider themselves “very satisfied,” are you doing a good job? Servicenow Benchmark gives you an easy way to asses and compares your KPI results across industries, Company Size, and Locations. Knowing where you really stand lets you make smarter decisions when you:
- Get this capability available in your instance at no cost.
- Compare yourself to industry leaders and start improvement related conversations.
- Set strategic goals that make sense for your organization
- Get actionable best practice recommendations and personalized guidance on achieving service excellence.
- Quick and easy to turn on/off in production with no development resources or risk.
- Fully automated, anonymous and secure.
How ServiceNow Benchmarks work
As the leading cloud platform, we have thousands of customers that are participating in automated Benchmarks. When customers opt-in, our platform anonymizes and aggregates the count data on each KPI, creating monthly benchmarks to compare your results against.
Here’s how the benchmarking process works:
- Opt-in to ServiceNow Benchmarks from your production instance
- KPI data is anonymized, aggregated at a very high level (e.g. Industry category with > 100 participation) to calculate monthly Benchmarks.
- Review your results—latest benchmarks will be available within your instance
- Segment benchmarks by number of filters (e.g., industry, size, geo) for more granular comparisons
- Use best practice insights and recommendations to make continual improvements.
Go ahead and check-out Benchmarks in your instance and let me know what do you think.
Additional resources:
- FAQ: Benchmarks FAQ
- Blog: How does the new KPIs are added to ServiceNow Benchmarks?
- Blog: Set performance goals based on real-life IT benchmarks
Labels:
- 769 Views
You must be a registered user to add a comment. If you've already registered, sign in. Otherwise, register and sign in.
