- Mark as New
- Bookmark
- Subscribe
- Mute
- Subscribe to RSS Feed
- Permalink
- Report Inappropriate Content
06-10-2015 10:13 AM
Hi all, am a new system administrator and heard the community is a great place to get it
I'm trying to define chart colors for some SLA reports and can't seem to get the colors to change. I've gone to Reports>Administration>Chart Colors and created entries for both the task_sla table and the incident_sla table using the element SLA and setting the value to the sla name that we've defined, then selecting the Color name (have added our colors to Color Definition).
Can't figure out where I'm going wrong and would appreciate any help.
Report info:

Rendered report - want to change the colors from these default colors to our company colors if possible:

Solved! Go to Solution.
- Mark as New
- Bookmark
- Subscribe
- Mute
- Subscribe to RSS Feed
- Permalink
- Report Inappropriate Content
06-10-2015 01:21 PM
Hi Leah,
Welcome to the wild world of ServiceNow! You are encountering a pretty common issue. The SLA field you are grouping by is a Reference Field which behaves a bit different. Reference fields have a value and a display value. The display value is what you see as the administrator, SLA Class B for example. ServiceNow doesn't understand the display value though, it only understands the value which for reference fields is the sys_id, a unique identifier for every record.
So that is the background, to fix it, we need to change the value you are putting in the Chart Color form's value field from the display value to the value. Heres what you need to do:
1. Navigate to the list of SLA Definitions
2. Right click on the row of one of your definitions
3. In the context menu, click Copy sys_id
4. Copy the sys_id in the pop up and close the pop up
5. Navigate to the Chart Color record for the SLA Item you just copied
7. Paste the sys_id into the Chart Color value field
8. Repeat this for each of the SLA's
You may need to reset server cache and/or browser cache to see the effects, I can't remember if its necessary or not. If you don't see the effects when you run the report, type cache.do into the navigation filter and clear your browser cache.
Let me know if any of this doesn't make any sense
- Mark as New
- Bookmark
- Subscribe
- Mute
- Subscribe to RSS Feed
- Permalink
- Report Inappropriate Content
06-11-2015 09:04 AM
You can do this in Fuji by changing the glide.ui.chart.default.colors property in sys_properties. I am not sure if you can change the default in earlier instances.
- Mark as New
- Bookmark
- Subscribe
- Mute
- Subscribe to RSS Feed
- Permalink
- Report Inappropriate Content
06-12-2015 06:11 AM
Thanks again Travis for your quick response!
We are running Fuji.
I went to the type filter text box, typed sys_properties.list and got the System Properties listing. I searched for Name=glide.ui.chart.default.colors, but I don't see an entry (and I don't know anything about glides, how they work, or how to use/modify them - don't have any experience with that).
Again, thanks!
- Mark as New
- Bookmark
- Subscribe
- Mute
- Subscribe to RSS Feed
- Permalink
- Report Inappropriate Content
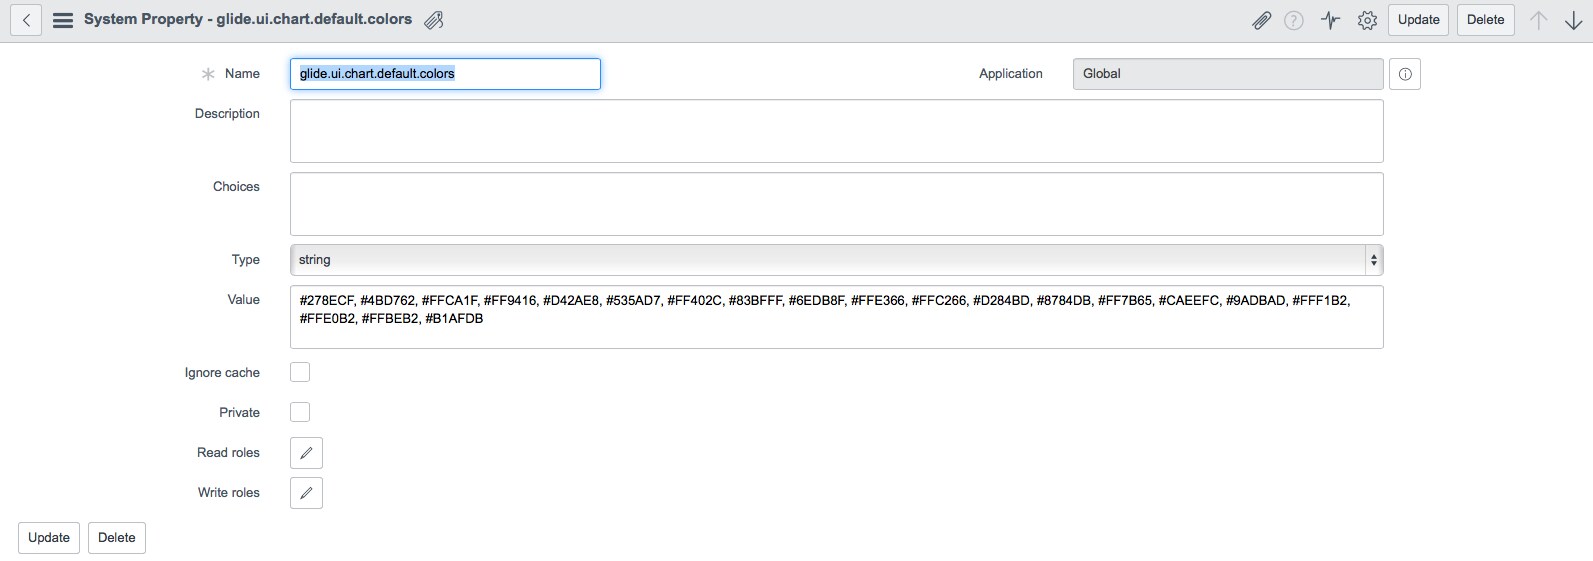
06-12-2015 08:10 AM
Hi Leah,
No worries, it looks like instances upgraded to Fuji won't have the property created by default. Only those initially installed with Fuji. You can create a new sys_properties record with that name and the system will use it accordingly. Here is a snapshot of the same record in my dev, if you mimic it, you should be able to change the hex colors to your desired colors:

- Mark as New
- Bookmark
- Subscribe
- Mute
- Subscribe to RSS Feed
- Permalink
- Report Inappropriate Content
08-20-2015 01:57 PM
Ran across this post and added the property glide.ui.chart.default.colors to my Fuji dev instance with my list of hex color names, cleared the cache and not having any luck having a report/chart use my new colors.
Any thoughts on some other property to update?
- Mark as New
- Bookmark
- Subscribe
- Mute
- Subscribe to RSS Feed
- Permalink
- Report Inappropriate Content
01-18-2016 05:07 PM
Is it that the charts just don't respect the color codes you chose? Is it supposed to be blue but returns as red? It could be related to Chart Color definitions don't match the report display when color code begin with #F0