Customer survey dashboard

ShiningStar1
Tera Contributor

Hello All,

Thank you in advance.

Can anyone please help me in knowing how to prepare this type of dashboard .Screenshot attached.

Regards


4 REPLIES 4

Community Alums
Not applicable

HI @Steffi Pradhan ,

The Type of Report you are expecting is called as " Single score report"

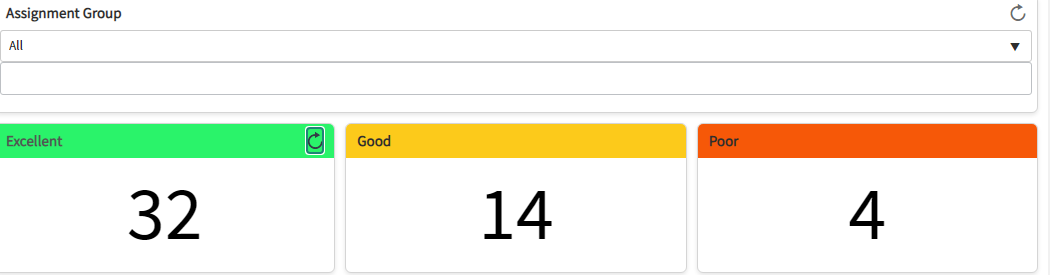
Create a single score chart to display a metric or score that is key to your business. The value updates in real time on a dashboard.

Before you begin

Role required: itil, report_user

Procedure

  1. Navigate to Reports > Create New.
  2. Navigate to Reports > View / Run.
  3. On the Data tab, give the report a name that reflects the information being grouped.
  4. Select the applicable source for the report.
    Option Description
    Data source Also called a report source, a data source is a table with filters applied to provide a single source of information for all users. For more information, see Report sources.
    Note: If you select a data source used by existing reports, a notification prompts you to view them.
    Table The raw data from a table with no filters applied. When you select a table, its short description appears below the table name.

    For trend reporting, you can also select a remote table, which aggregates, in memory, data retrieved from an external source. Then select a Trend by field option to aggregate its data. To learn more about remote tables, see Retrieving external data using remote tables and scripts

    External import Choose an existing imported report source, or click the Upload icon (Upload icon) to import a new file. See Create a report from an imported Microsoft Excel document.
    MetricBase MetricBase enables you to collect, retain, analyze, and visualize custom time series data on the Now Platform. For more information, see MetricBase.
  5. Click Next.
  6. On the Type tab, enter Single score in the filter, select the report type, and click Next.

    The application shows a preliminary version of the report. To view the updated report at any time, click Run.

  7. On the Configure tab, fill in the following fields and click Next.
    Configuration tab
    Field Description
    Configure function field Configure fields based on calculation of multiple inputs including arithmetic functions. For more information, see Report on function fields. Function field results are calculated when the report is run. You can use the results for aggregations and grouping. You have to save the report before you can configure function fields.

    Configured function fields appear in the Group by and Additional group by lists after you save the report.

    Aggregation Computational method for aggregating report data. The default is Count, which displays the number of records selected.
    Note: A single score chart displays only the aggregate value.

    If you select Count Distinct, only unique records are counted. For example, you want to generate a report with a distinct number of users who have one or more of the roles in a given list of roles. Users with more than one role would be counted twice unless you use Count Distinct.

    If you select AverageSum, or Count Distinct, a list of fields from the selected Table appears. You may further be able to aggregate on fields from extended tables. See How to report on extended tables. Select a field to aggregate by from this list. For example, if you select a duration field, such as Business duration on the Incident table, the aggregated data is expressed in days, hours, and minutes.

    If you select an integer field, such as the Priority field, the data is expressed as a number. You may further be able to aggregate on fields from extended tables. See How to report on extended tables.

    Set Value Formatting

    Enables you to configure how to show numerical values in reports, including decimal precision, rounding, minimum and maximum duration units, and abbreviations for duration units. See Value formatting in reports.

    Note: Decimal precision does not work on currency fields.
    Note: Currency fields default to two decimal places. With the Set Value Formatting option, you can configure decimal precision for 0-4 decimal places.
  8. (Optional) To limit the information displayed in the report, click the filter icon (filter icon) and select conditions to filter the report data.
    To learn how to construct conditions, see Condition builder.
  9. On the Style tab, fill in the fields as appropriate to configure the appearance of the report.
  10. Click Save.

What to do next

  • Click the Report info icon (Report info icon) and add a description of the report.
  • Click the sharing icon (Sharing icon) to open the Sharing menu. On this menu, you can share the report with users and groups, add the report to a dashboard, and publish the report to the web.

Single score report style options

Change the look of your single score report.

When you create or edit a report, click the Style tab for options to configure the look of your report. The options are organized under two or more of the following tabs: GeneralTitleLegend, and Axis. To see how the report looks with the changed settings, click Save.

Single score chart style options
Field Description
General
Display Zero Check box to display the number 0 when the value of the report is zero. Clear this check box to display an error message when the value of the cell is 0. Applicable when Aggregation is Count or Count Distinct.
Default color Color of the score in the chart.
Drilldown view List view to show when a user selects a segment of a report for which no drilldown report type is specified. This view is also used when the user reaches the lowest drilldown level of a report. See Configure the list layout . If you specify a Report drilldownDrilldown view is ignored.
Note: All users are able to view report visualizations, such as pie charts and column reports. However, the last level of a report drilldown is always a list. Platform access control lists determine user access to list information. Users who do not have rights to any part of the list data see the message "Number of rows removed from this list by Security constraints:" followed by the number. See Access control rules.

For more information, see Define a report drilldown.

Edit coloring rules Click this hyperlink to configure how values are colored in the report. You can create rules to define which colors are used based on operators and values. For example, you can specify that any value greater than 5 displays in red. See Create coloring rules for single score reports.
Title
Show chart title When the chart title is shown for the report.
  • Never: Never show the chart title.
  • Report only: Shows the chart title on reports.
  • Always: Shows the chart title on reports, dashboards, and homepages.
Chart title The chart title has a maximum length of 40 characters. If no title is entered, the report name is used for the title. This field appears when Report only or Always is selected from the Show chart title list.
Size of the chart title Size of the chart title in pixels. This field appears when Report only or Always is selected from the Show chart title list.
Chart title color Color of the chart title. This field appears when Report only or Always is selected from the Show chart title list.
Title horizontal alignment How the chart title is aligned horizontally. This field is available when the Custom chart title position option is cleared.
Title vertical alignment How the chart title is aligned vertically. This field appears when Custom chart title position is cleared.


Mark my answer correct & Helpful, if Applicable.

Thanks,

Sandeep

Hi @Sandeep Dutta 

Please help me how can i add the assignment groups in the dashboard.


Regards


Community Alums
Not applicable

HI @Steffi Pradhan ,

Your original question has been answered !! You can raise another question in the community!!

Kindly mark the answer as Correct & Helpful both such that others can get help.

Thanks,
Sandeep

Hi @Sandeep Dutta 

Its the same question as the screenshot is attached. 


Regards