Percentage of Incidents Meeting SLA by Month
- Mark as New
- Bookmark
- Subscribe
- Mute
- Subscribe to RSS Feed
- Permalink
- Report Inappropriate Content
06-10-2014 04:58 AM
Hello All!
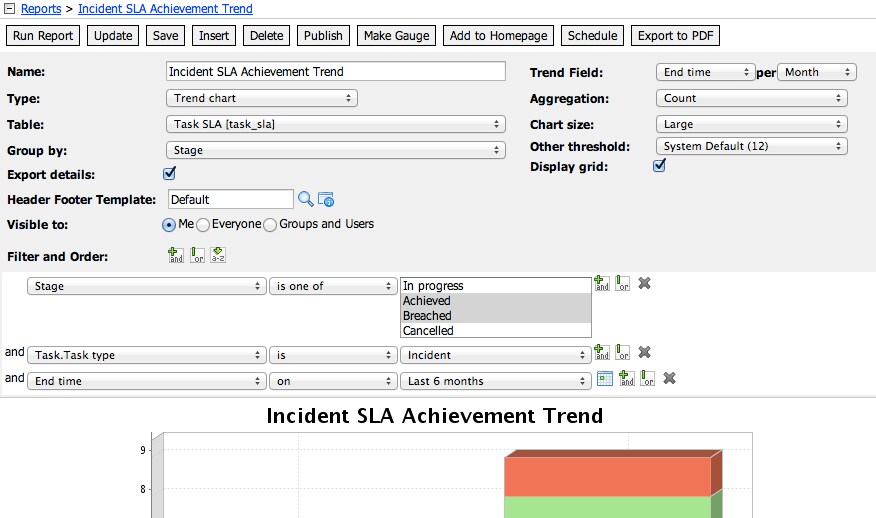
I am trying to help write a report for my manager that looks like the chart below. The idea is to provide a trend chart, by month, of SLAs that have achieved SLA. Using the provided reports in ServiceNow, I haven't quite been able to achieve the same style report. Any thoughts?

- Mark as New
- Bookmark
- Subscribe
- Mute
- Subscribe to RSS Feed
- Permalink
- Report Inappropriate Content
06-11-2014 07:39 AM
Calling any master report builders!!
- Mark as New
- Bookmark
- Subscribe
- Mute
- Subscribe to RSS Feed
- Permalink
- Report Inappropriate Content
06-11-2014 09:08 AM

- Mark as New
- Bookmark
- Subscribe
- Mute
- Subscribe to RSS Feed
- Permalink
- Report Inappropriate Content
06-11-2014 10:56 AM
Thanks for the info Mark! It is closer than we had before, but I am now wondering if the exact format of the example graph is even able to be recreated in ServiceNow. I haven't been able to find a way or an example of adding the percentages on the bars, trend line, or to aggregate by percentage instead of count/average/sum.
- Mark as New
- Bookmark
- Subscribe
- Mute
- Subscribe to RSS Feed
- Permalink
- Report Inappropriate Content
06-11-2014 11:04 AM
Without setting up a completely custom chart (which is a royal pain to build and manage) that is about as close as you'll get. You do get the percentages by hovering over the bar sections and you can also see them in the details of the report if you're showing details. The only thing I see that you're missing is the trend line after that. Seems like an extremely close fit.