SLA Performance Trend report
- Mark as New
- Bookmark
- Subscribe
- Mute
- Subscribe to RSS Feed
- Permalink
- Report Inappropriate Content
02-25-2019 11:32 AM
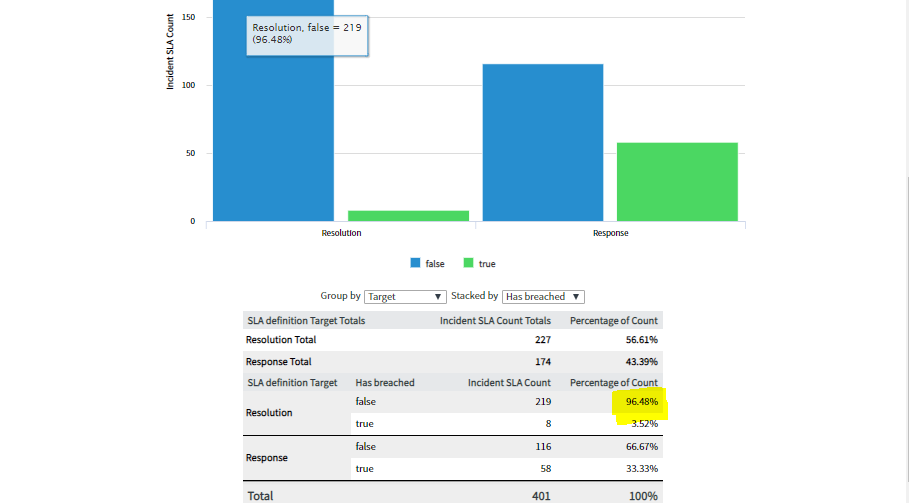
I am trying to build a report to display SLA performance trend daily, weekly or by any defined time. The report should show the percentage of incidents which meet the defined SLA. Currently i have a report which shows has breached, incident SLA count and percentage of count.

I am looking to convert this to a time series graph which displays the percentage of incidents that meet SLA (Has Breached = False) for any defined time period. The report below shows my attempt, could i have gotten it right?

- Labels:
-
Service Level Management
- Mark as New
- Bookmark
- Subscribe
- Mute
- Subscribe to RSS Feed
- Permalink
- Report Inappropriate Content
02-25-2019 12:12 PM
Your time series chart reports looks good.
IF you have performance analytics, you can also explore multiple data sets functionality to show SLA breached, achieved percentages in one time chart.
https://docs.servicenow.com/bundle/geneva-performance-analytics-and-reporting/page/use/advanced_reporting/concept/c_MultipleDataSets.html
Regards,
Sachin
- Mark as New
- Bookmark
- Subscribe
- Mute
- Subscribe to RSS Feed
- Permalink
- Report Inappropriate Content
02-09-2021 04:02 AM
Hi,
I have been searching all over the internet to get this graph or information as to how to pull this report. Though this serves my purpose, can you please help me with what all report settings did you keep to fetch this result.
Im trying to pull this on servicenow for Tasks and Incidents SLA which are Breached and Not Breached.
Looking forward to your help on the same