


Dawn Jurek

ServiceNow Employee
Options
- Subscribe to RSS Feed
- Mark as New
- Mark as Read
- Bookmark
- Subscribe
- Printer Friendly Page
- Report Inappropriate Content
08-11-2017
08:32 AM
Did you know that the ServiceNow platform provides robust and easy-to-use reporting functions? Are you taking advantage of these features to get critical live data out to your managers, co-workers and project teams? In this installment of our best practices series, we look at best practices for creating and sharing reports.
Note that you must have the admin, report_admin, or itil role to create or modify reports.
With the Jakarta release, we've enhanced the Report Designer to make it even easier to create and share reports. Reports can be created from the Create New module under the Reports application, or directly from the dashboard. You can also create a report directly from a list by right-clicking on a column and selecting Bar Chart or Pie Chart.
Choose clear and concise names for your reports
You're probably creating reports with the intention to share the information with other groups and users, so be sure to choose clear and concise names to make it obvious to other users what data they can expect to see. Here are some examples:
- Poor report name: 2017 Incidents
- This name is vague - it tells the user nothing about the incidents shown in the report, except that they occurred in 2017.
- Better report name: Critical IT Incidents - January to June 2017
- This name tells the user what type of incidents are in the report, the assignment group, and the timeframe.
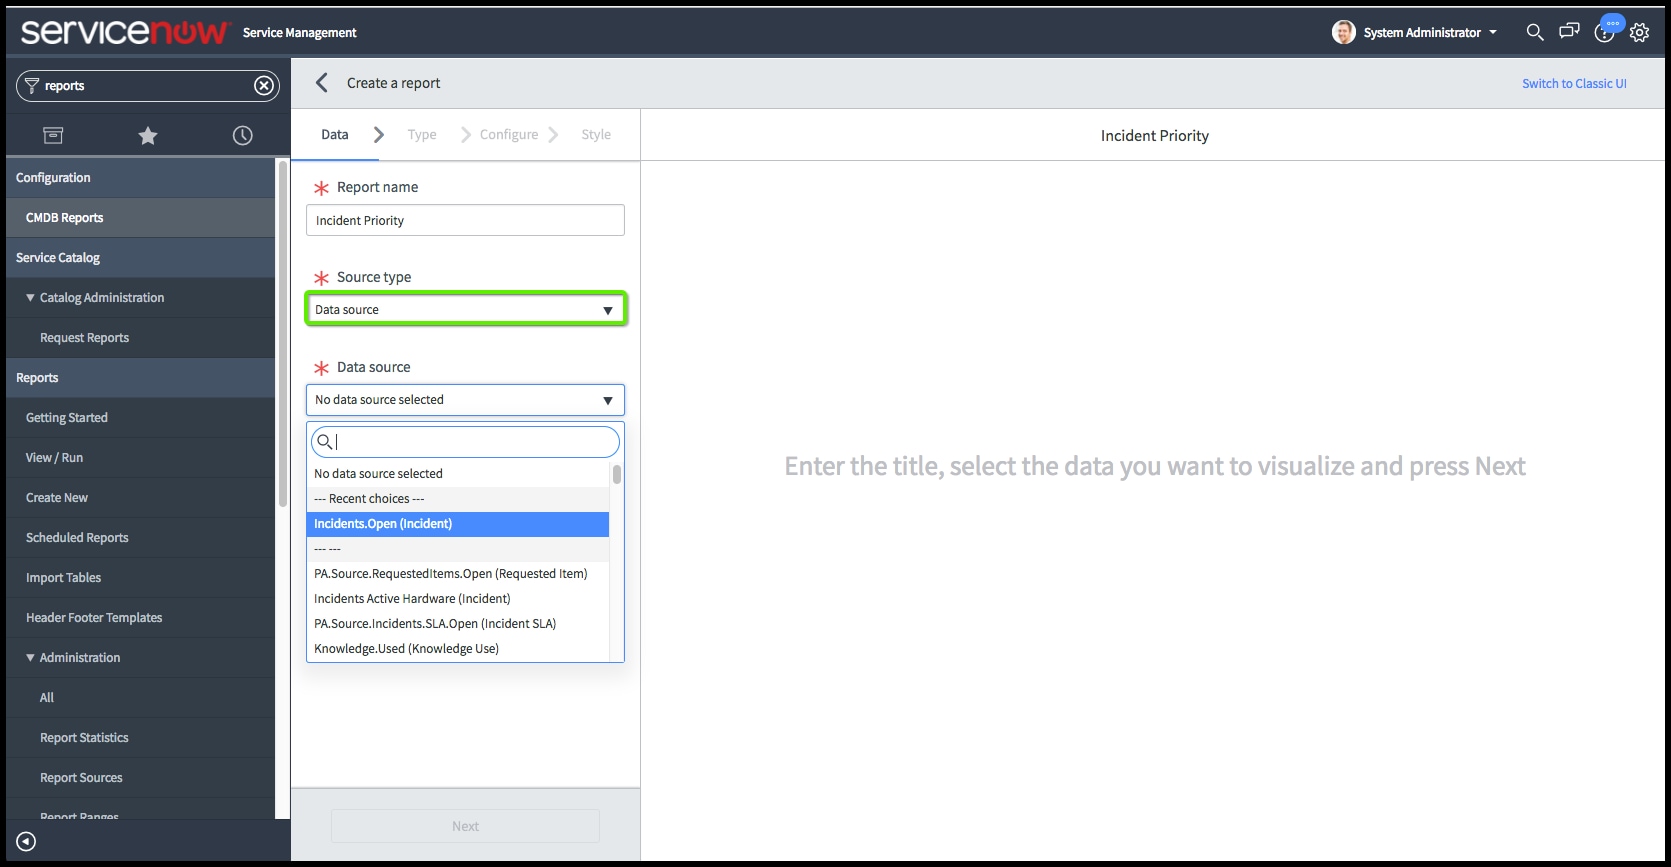
Create or use existing report sources as the source type for your reports
When creating a report, you can use either a table or a data source as the Source type:
When using a table, you need to set the conditions for each report individually—even if the conditions are the same from one report to another.
A better solution is to create a report source (also called a data source; see note below) or use an existing one. A report source defines a standard set of conditions for querying a particular table, which can then be used in other reports. An advantage to setting up report sources is that you can be sure users are always creating reports on the correct data set when they use a report source versus a table. As an additional benefit, you can edit a report source when a condition changes, and all the reports that use that source are updated as well.
In the Report Designer and Report Builder, report sources are called data sources.
You must have the report_admin or admin role to create a report source.
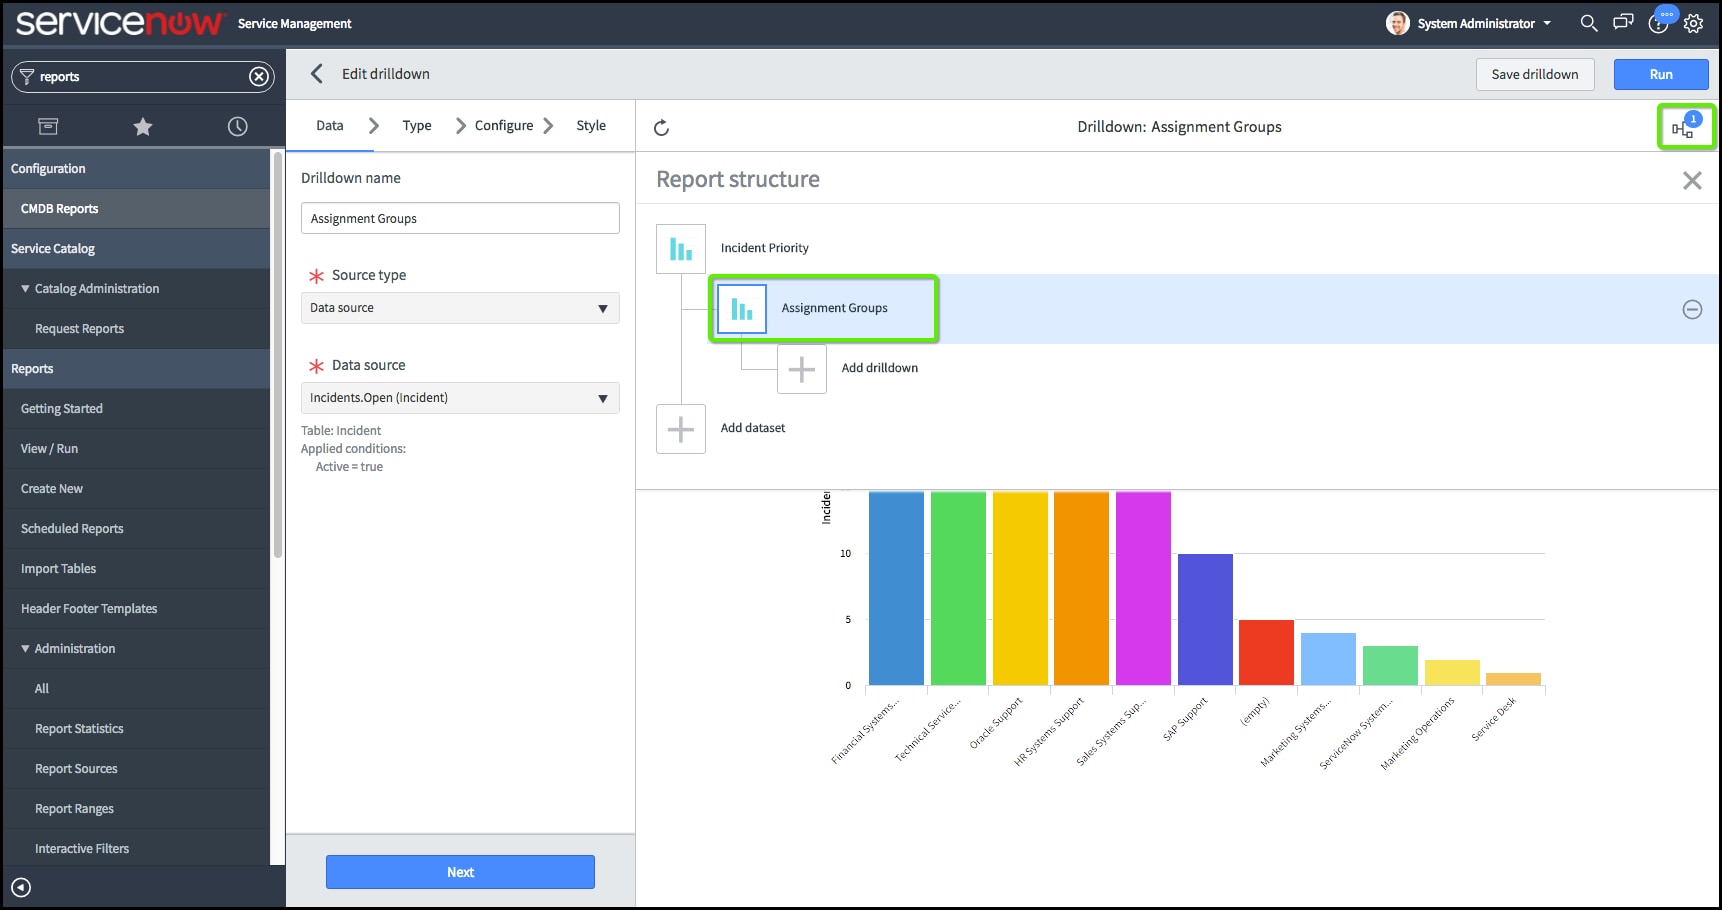
Enhance your reports with drilldowns and datasets
In addition to using report sources, you can take advantage of drilldowns and datasets to further enhance your reports. While they may not be needed for every type of report, they allow you to provide multiple types of data in a report when applicable.
Drilldowns add value to reports by providing additional visualizations, and they allow viewers to dive into sub-groups of data.
Datasets allow you to combine data from multiple tables in the same visualization. Here's an example of incident and problem data in one report:
Consider your audience when choosing the type of visualization for your reports
When selecting the type of visualization (pie chart, bar graph, list view, etc.) for your report, choose the option that best communicates the data contained within the report. Oftentimes several different options could work equally well for presenting the information, so consider your audience and what they'll be using the data for when making this choice. We have 25+ types of reports for you to choose from. Here is a complete list and description of each to help you decide which one to use: Report types and creation details
Use the Configure and Style tab options
The Configure and Style tabs allow you to further fine-tune your report visualizations. On the Configure tab, you select how the data is grouped. You also have the option to display table data.
The Additional group by option allows you to display multiple groupings in one report. The viewer can change the grouping displayed in the report via a menu. This option works great for widgets on dashboards.
On the Style tab, you can change the size, colors and other visual aspects of your report. Here, you can also choose to display data labels:
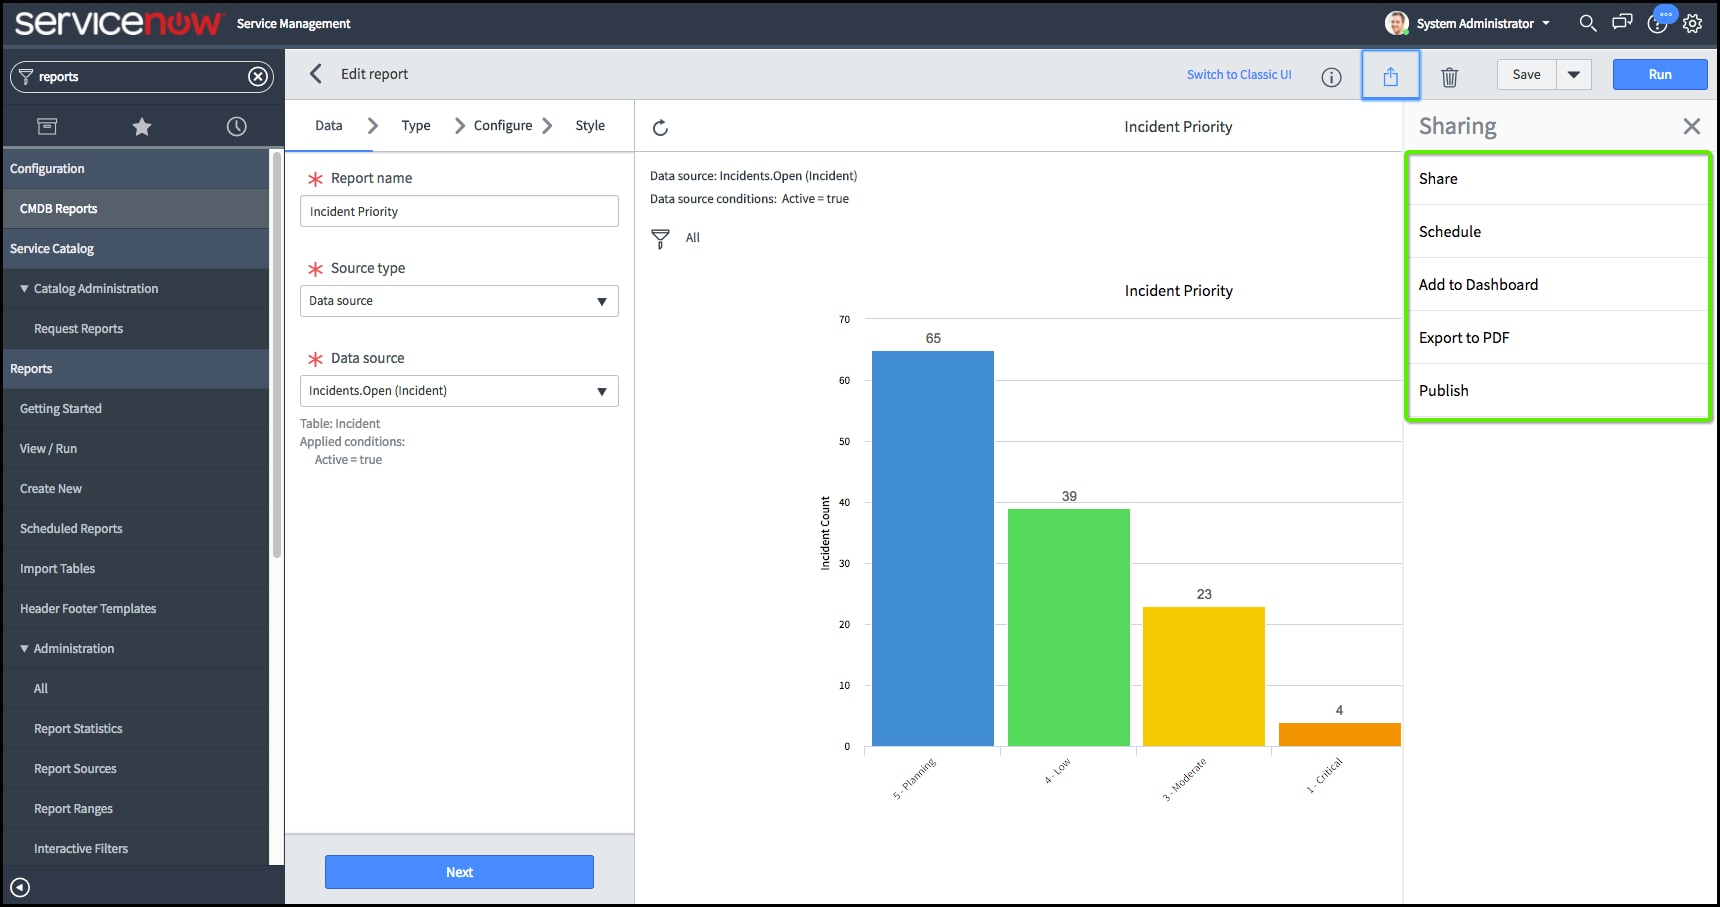
Choose the best method for sharing your report
Once you've created a report and saved it, you need to choose a method for sharing it. Which option is best? That depends on how you want to use it. Here's the rundown on the Sharing options, starting with those considered best practice because the data is live, not static.
Best sharing options
- Share — Allows you to share a report with different users and groups via the Report module, provided they've been given access to the data contained within the report.
- Add to Dashboard — Allows you to add the report to your dashboard where it can be displayed for easy viewing and access, without having to search for it.
Other sharing options
- Schedule — Allows you to run and share a snapshot of the report in PDF format at scheduled days and times.
- Export to PDF — Allows you to export a static copy of the report to print a hard copy, or to send as an email attachment. Keep in mind that this may be the least preferred method of sharing, as the data on this type of distributed report won't contain live data, and could be outdated by the time the receiver views it.
- Publish — Creates a URL that anyone can use to access the report, including people who are not users. When anyone navigates to the URL, the report is generated with current data from the instance; however, a user needs to be logged in to your instance to view individual records. When you Unpublish a report, it breaks the link, making the report no longer visible to anyone accessing that URL.
For more information, see:
- Getting started with reports
- TechBytes Episode 35: Reporting Tips and Tricks
- NowSupport YouTube playlist: Reporting
--
Behind the scenes here at ServiceNow, the Knowledge Management and Multimedia teams work closely with subject matter experts to disseminate critical information to our customers. We've found that certain topics come up frequently, in the form of best practices that can help you keep your ServiceNow instances running smoothly. This series targets those topics so that you and your organization can benefit from our collective expertise. If you have a best practices topic you'd like us to cover in this series, please let us know in the comments below.
To access all of the blog posts in this series, search for "nowsupport best practices series."
Labels:
- 16,675 Views
2 Comments
You must be a registered user to add a comment. If you've already registered, sign in. Otherwise, register and sign in.
