


Tom Pacyk

ServiceNow Employee
Options
- Subscribe to RSS Feed
- Mark as New
- Mark as Read
- Bookmark
- Subscribe
- Printer Friendly Page
- Report Inappropriate Content
12-16-2019
08:56 AM
We know that everyone has a natural inclination to start building dashboards at the beginning of an analytics project, and for good reason! Dashboards are the most exciting and glamorous part — these are the shiny objects that everyone will use on a daily basis to make their lives better, in theory. But the reality is that most analytics projects fail or run way over budget because the stakeholders who were supposed to use these dashboards were not aligned about what to measure or how it would be measured. So these glorious dashboards and configurations your teams worked tirelessly to build either go unused or have to be completely redesigned once the stakeholders get a peek at your work.
To help you avoid these situations we are releasing KPI Composer — a brand-new, completely free tool available via the ServiceNow Store — so you can jump-start your Performance Analytics journey by visually mapping organizational objectives and business outcomes to measurements. KPI Composer ensures that your performance management strategy aligns with business goals and has support from executive sponsors before you begin any technical configuration.
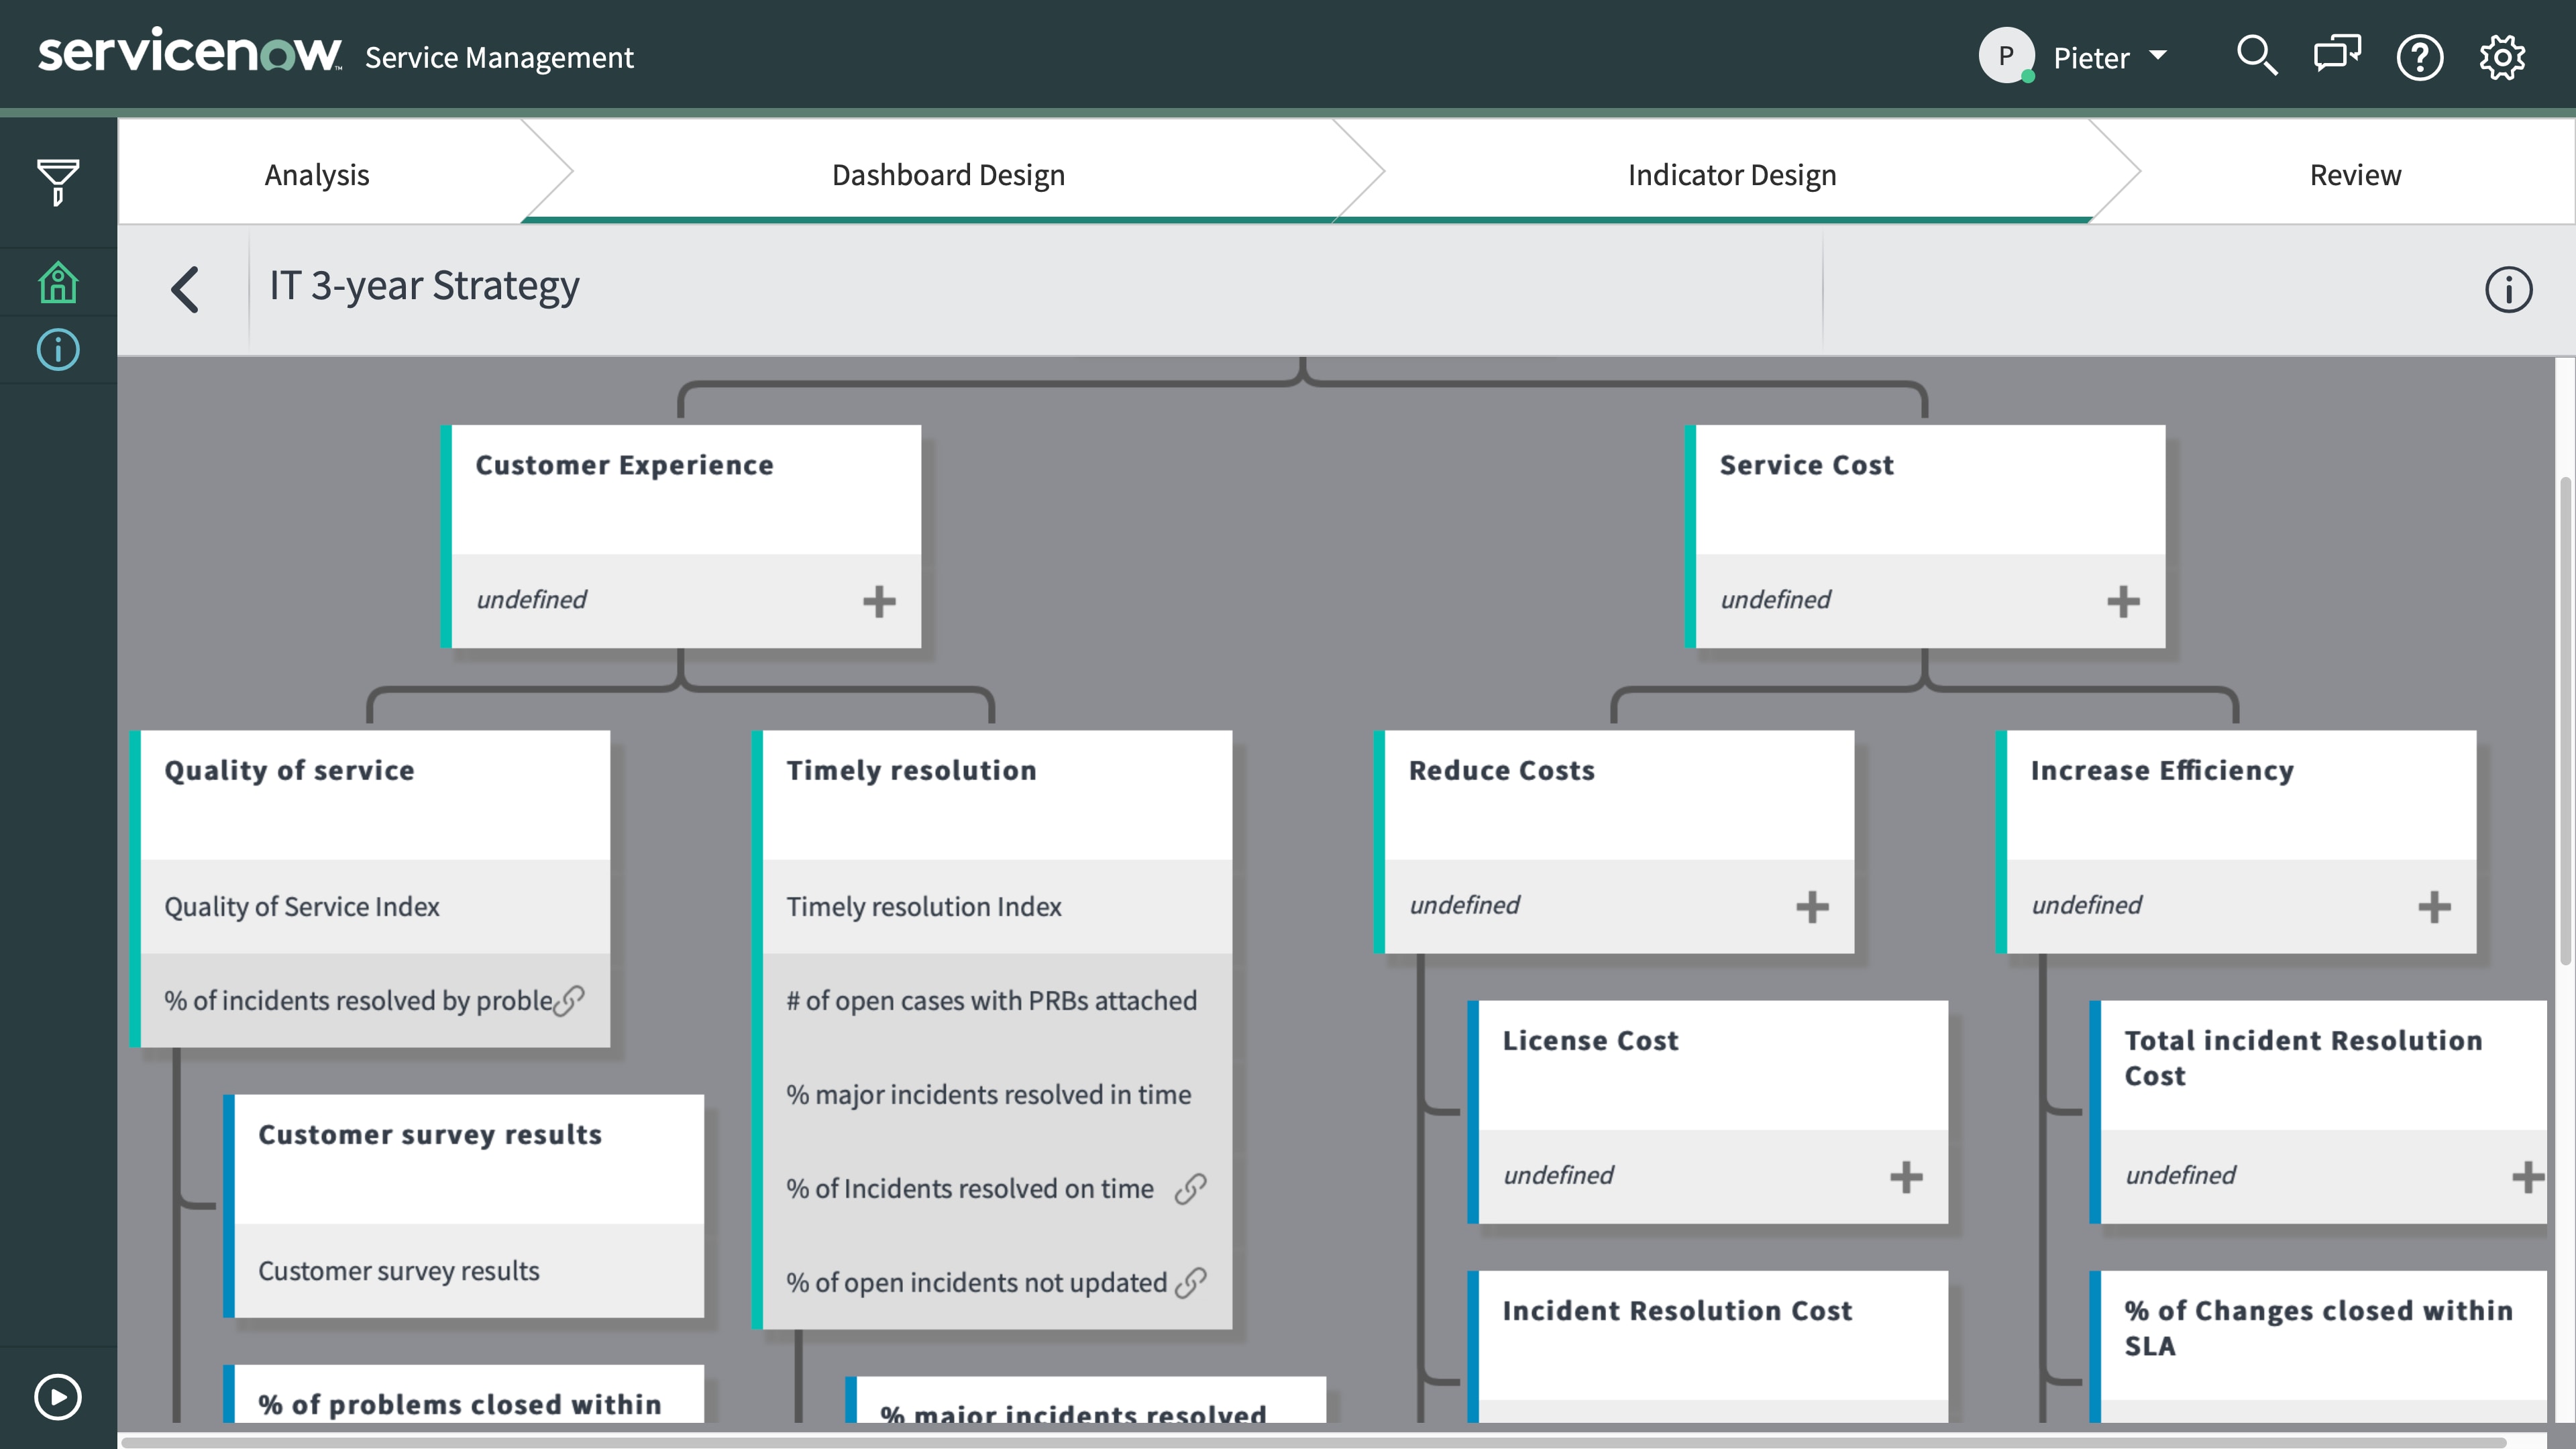
Visually connect objectives to critical success factors and measurements with KPI Composer
Analysis
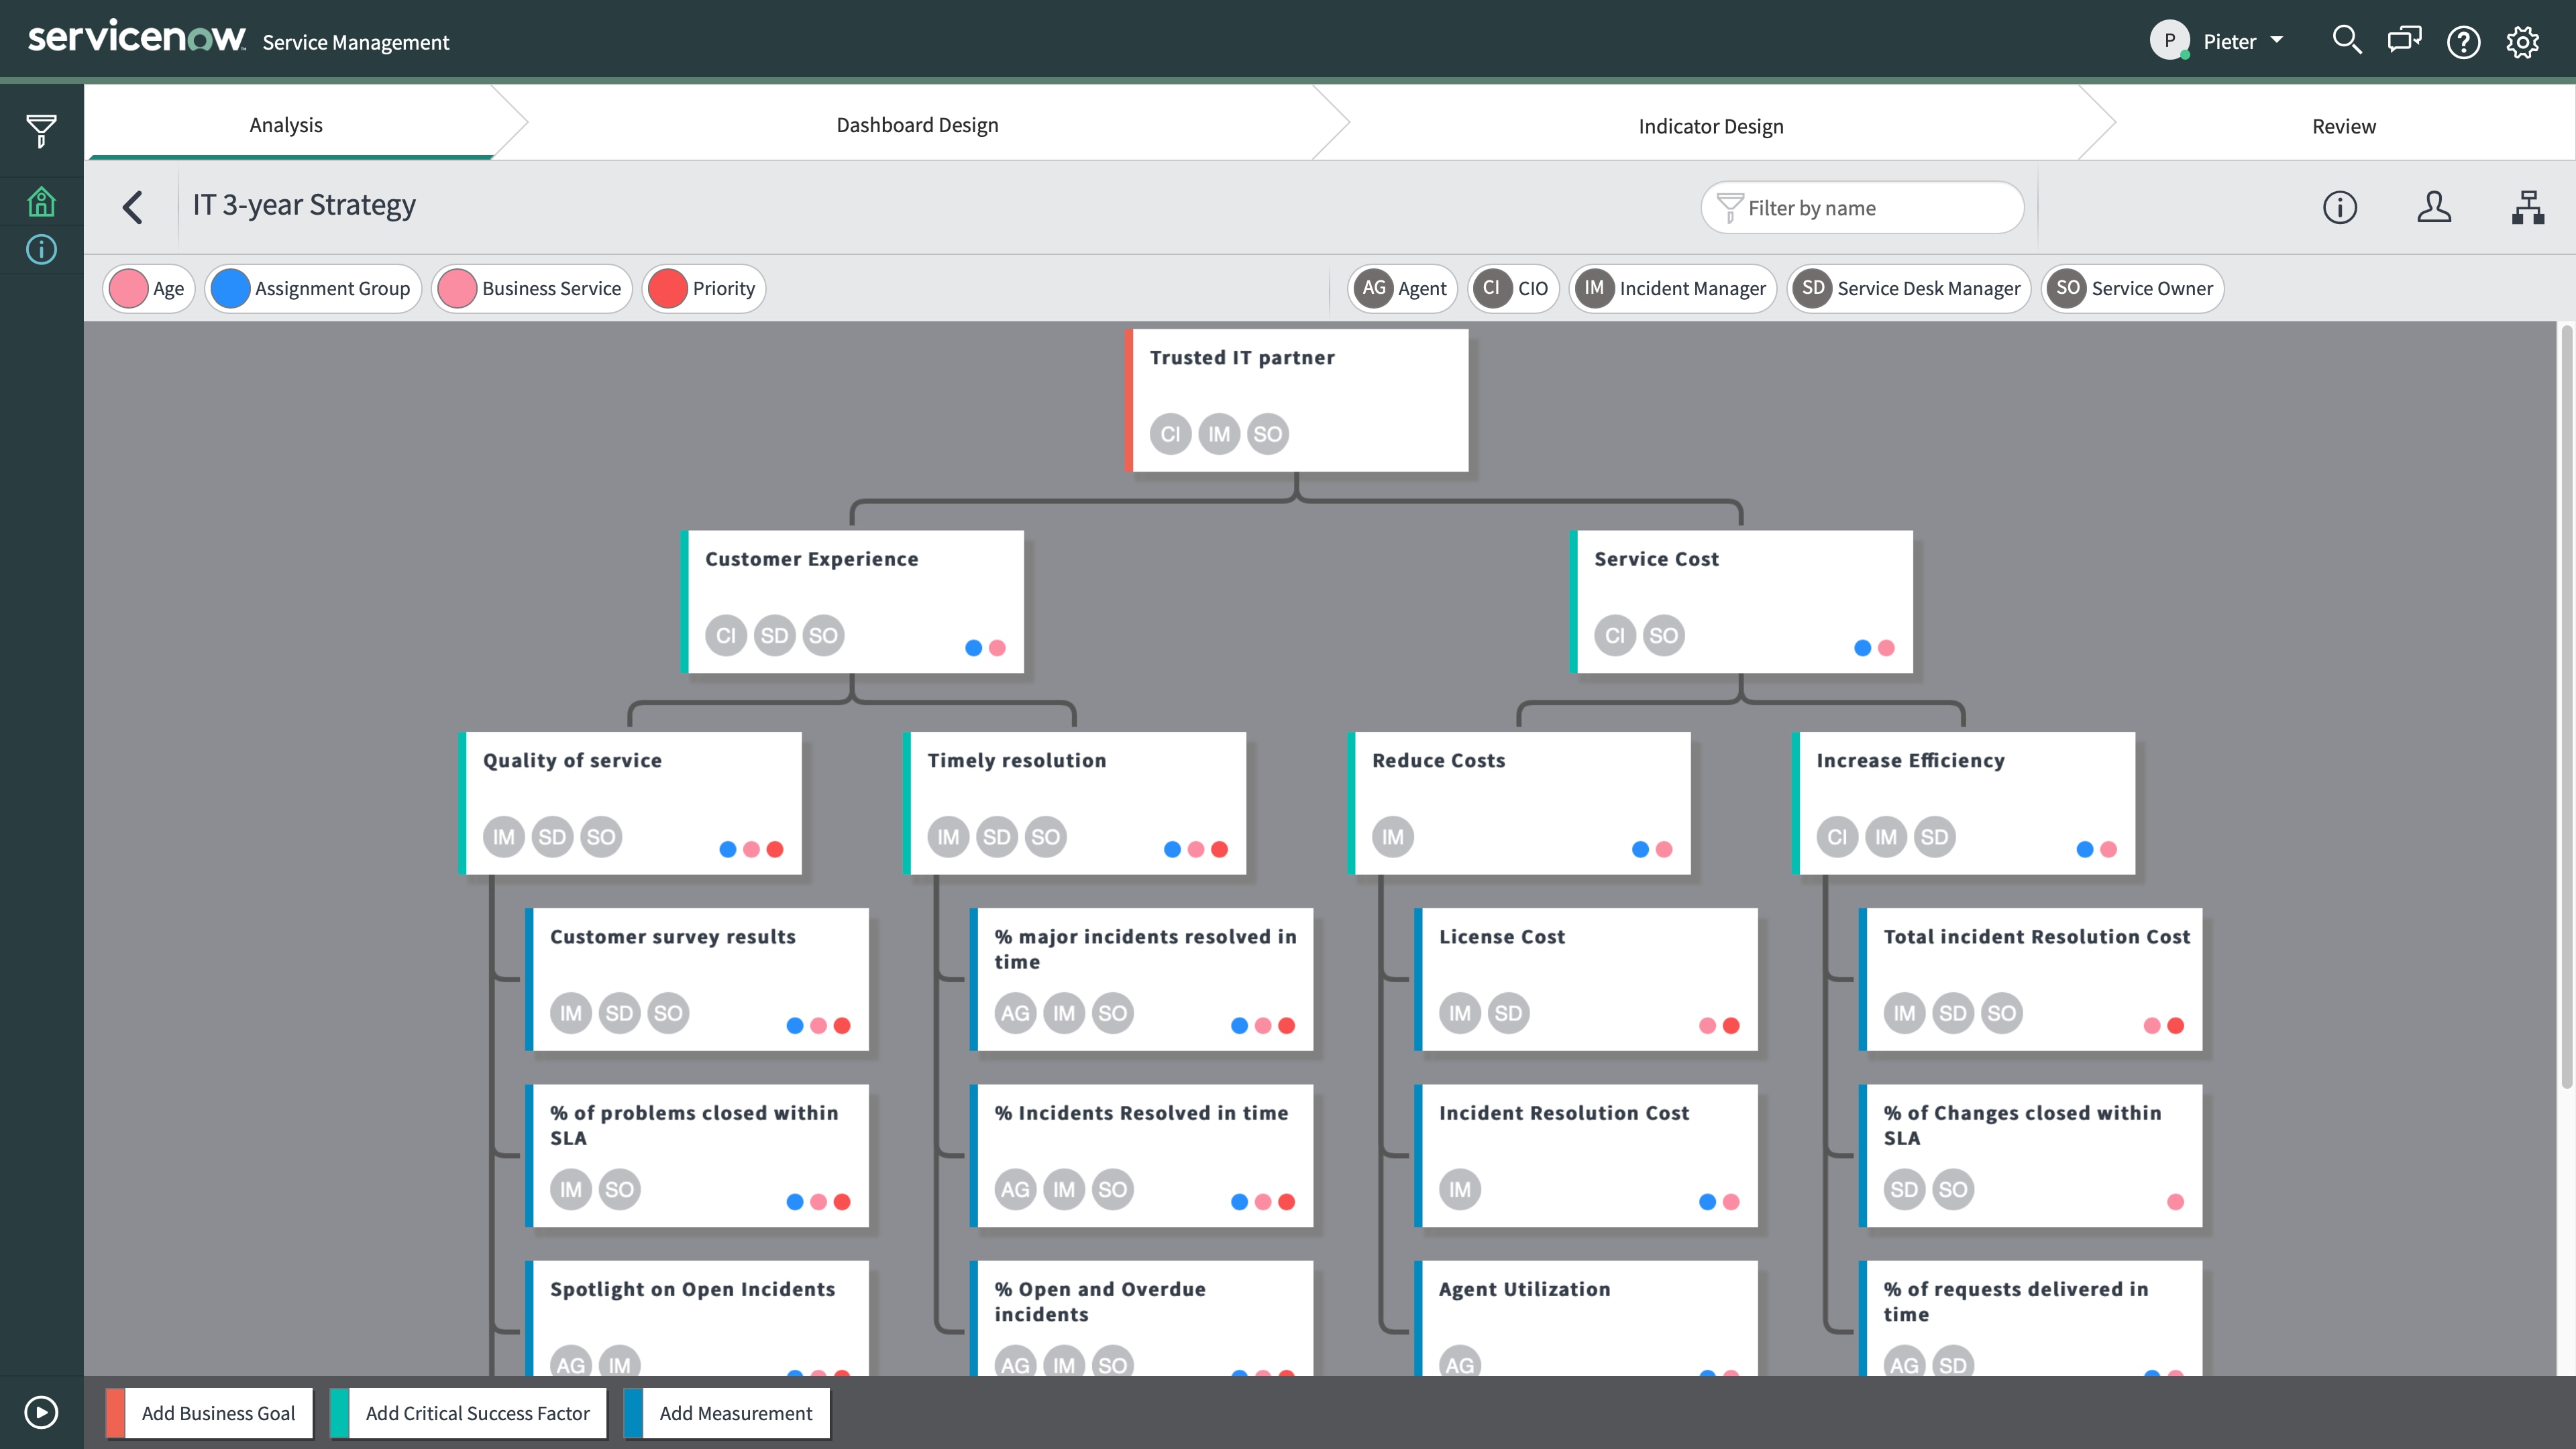
KPI Composer prepares you for your Performance Analytics implementation by walking you through four distinct phases: Analysis, Dashboard Design, Indicator Design, and Review. In the Analysis phase you’ll visually build a hierarchical tree that connects your business goals, critical success factors, and specific measurements (your KPIs), so you can easily see how each KPI supports your organizational objectives. It’s like a whiteboard design with superpowers because you can associate specific personas, breakdowns, or groupings with each tree element in this phase. After this step everyone will have a clear understanding of what you’re measuring and how those measurements roll up to support the business’ goals.
Dashboard Design
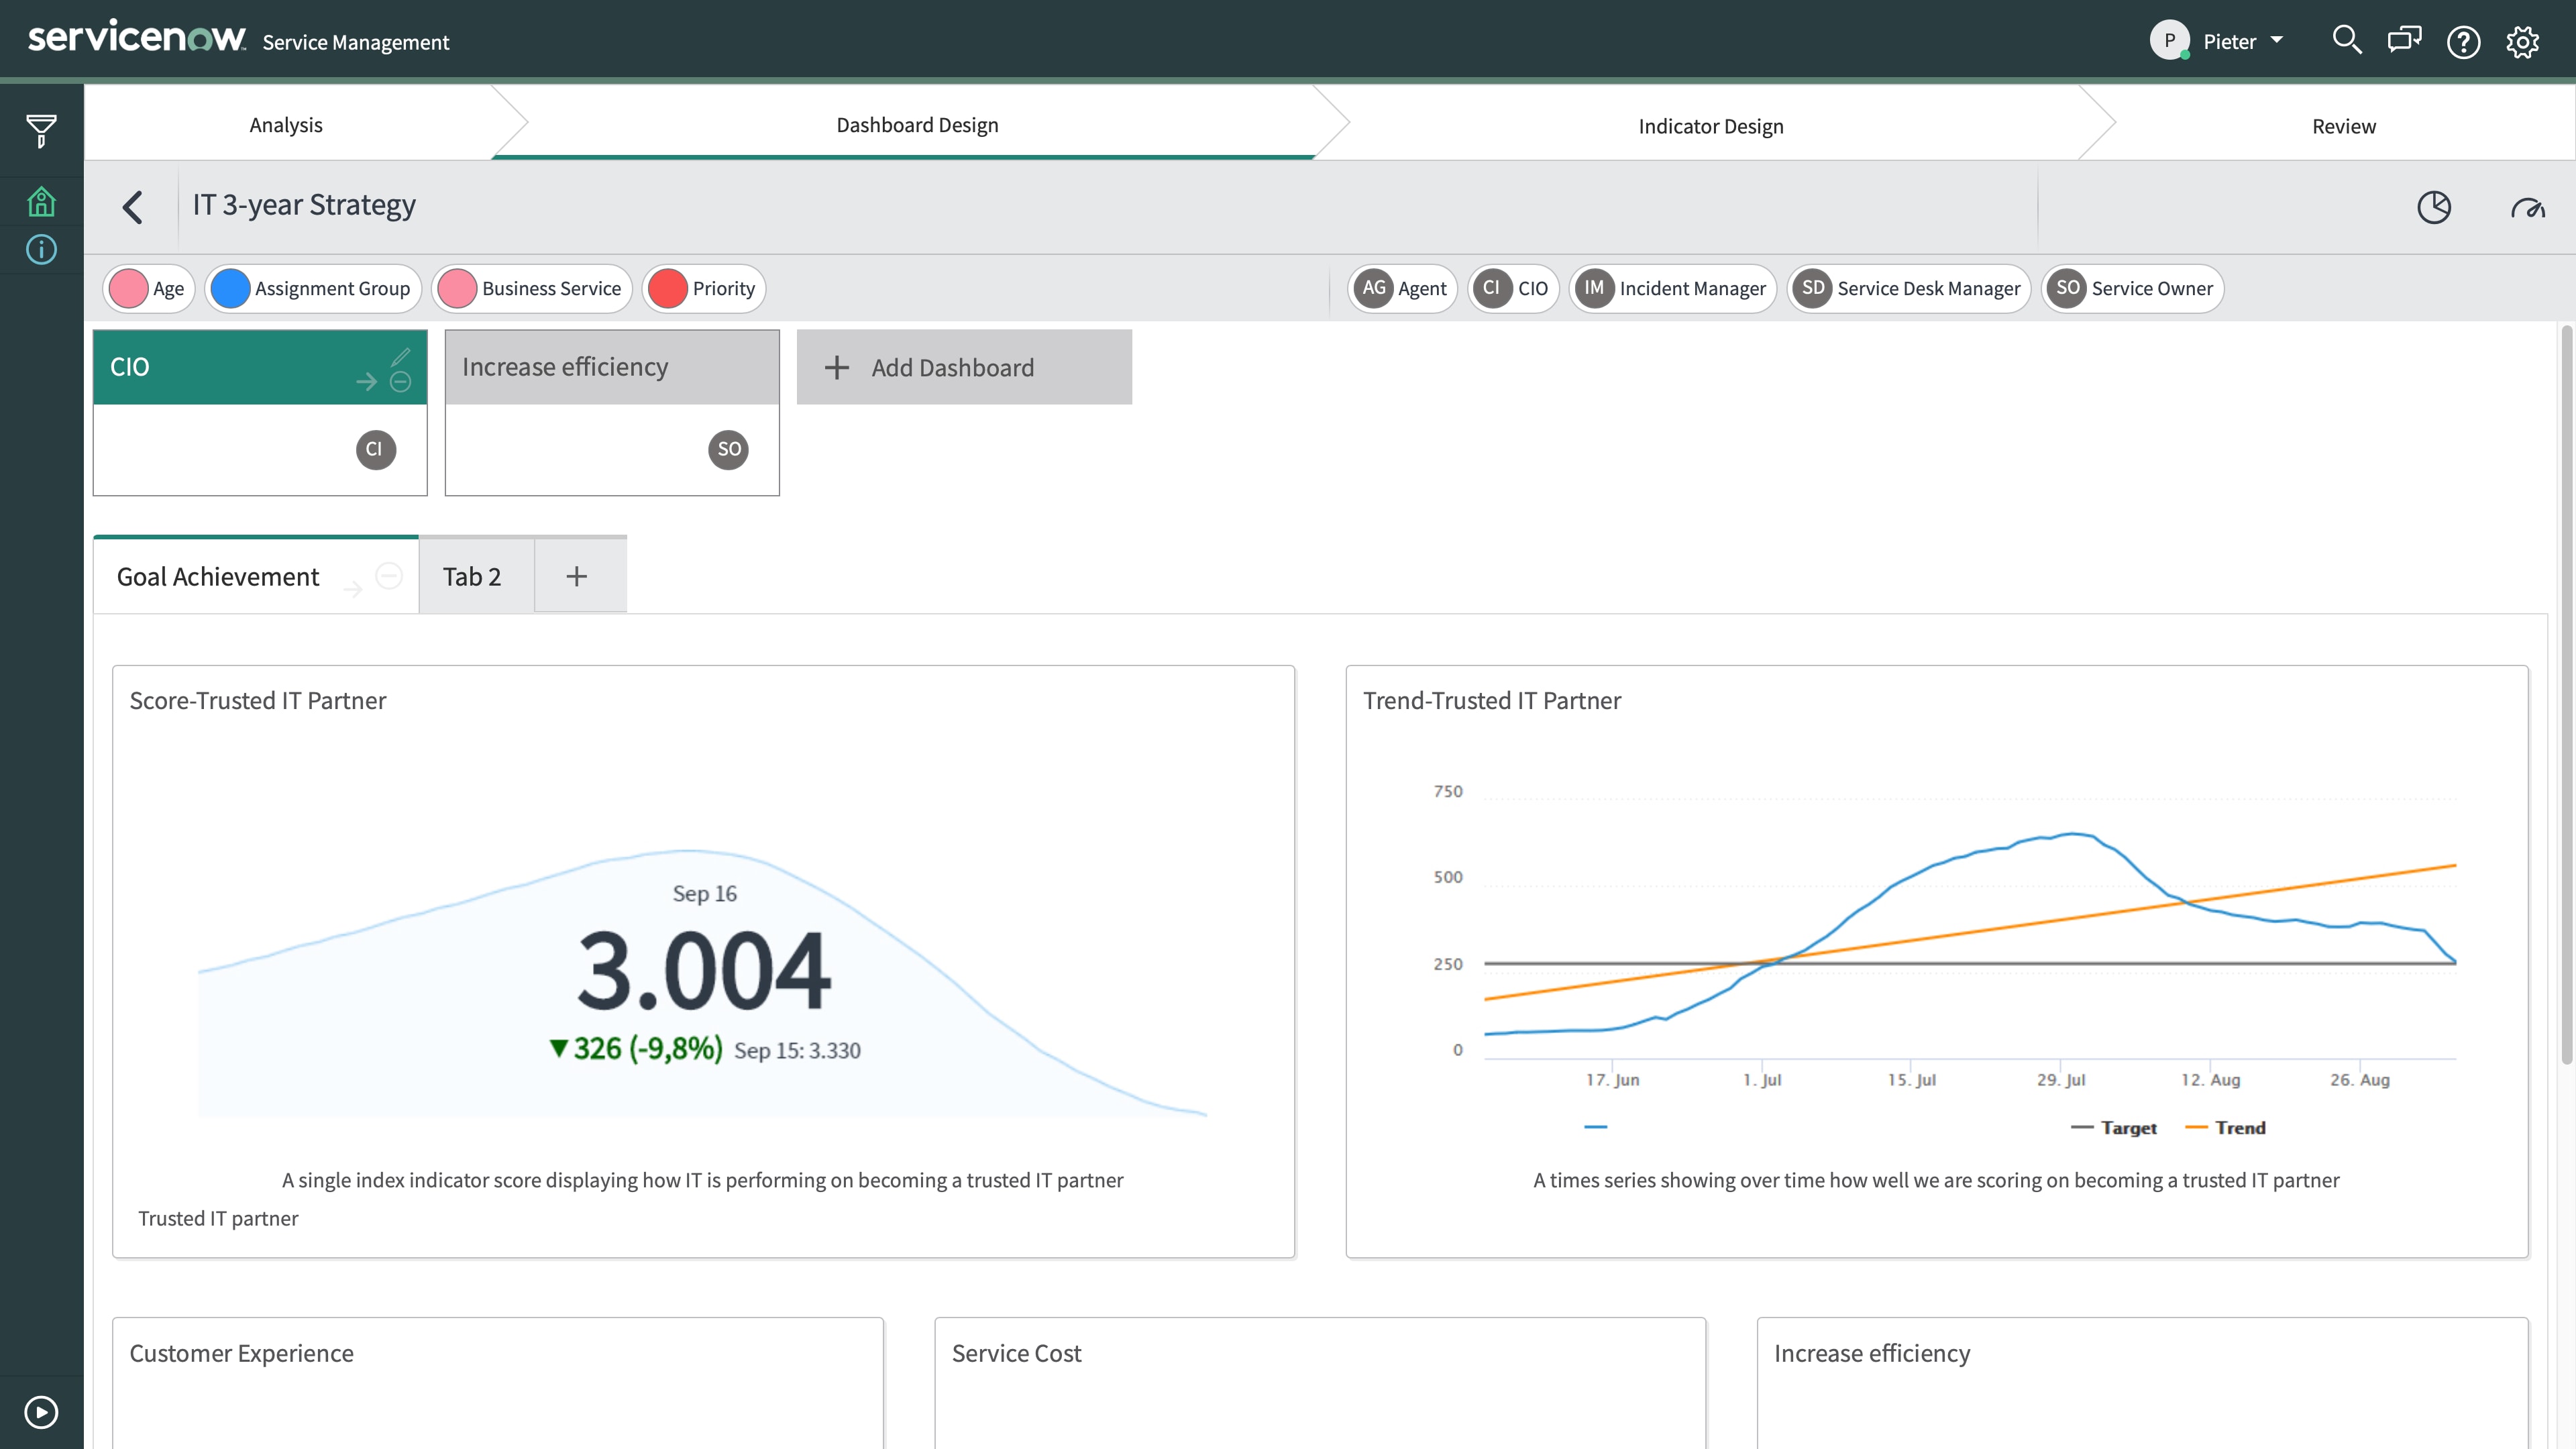
Next, you can begin laying out the Dashboard Design that supports these measurements. This phase enables you to create mock-ups of the actual Performance Analytics dashboards you’ll create later, but you can quickly design and iterate each screen so stakeholders can deliver early feedback and ensure their expectations are being met. Now you can receive sign-off on designs without spending cycles continuously reconfiguring and rearranging the different tabs and rows of visualization widgets.
Quickly create mockups of dashboards for each stakeholder
Indicator Design
After the dashboard designs are done you’ll start on the Indicator Design step where you connect the measurements defined in the Analysis phase to the actual indicators that will exist in Performance Analytics. You can either link those measurements to built-in indicators provided by ServiceNow or you can create your own, but in both cases you’re defining the exact measurement needed: how often it will be collected, how it might be aggregated, if it is a calculation that depends on other indicators, and so on. At the conclusion of this phase you will have completely documented how each goal, critical success factor, and measurement will be calculated.
Define specific measurements and formula calculations for each KPI
Review
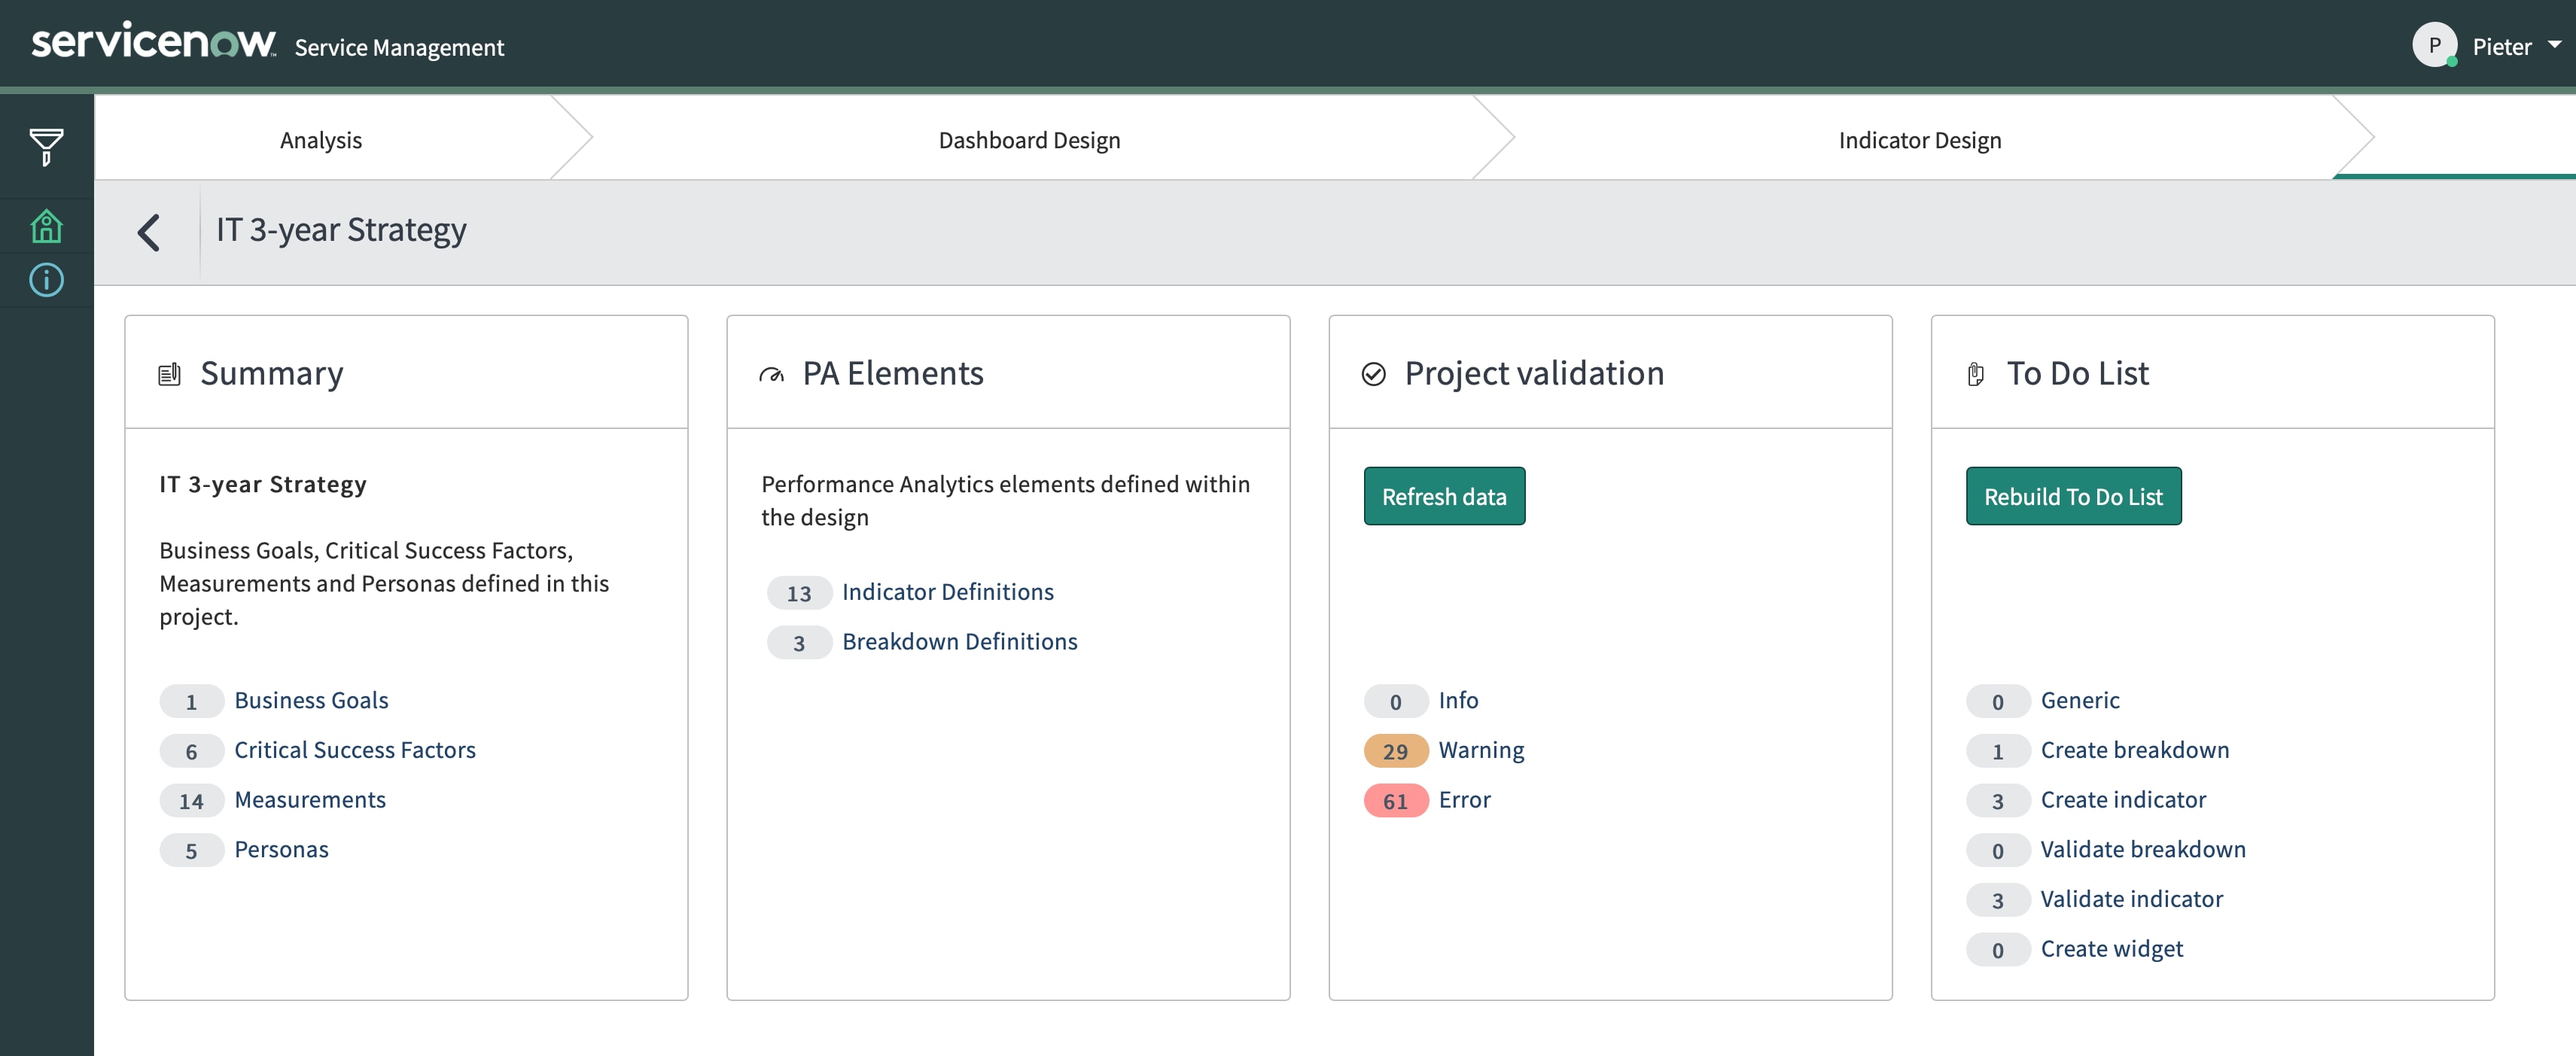
At the end of the process you’ll get to the Review phase which validates what you’ve done and also leaves you with the blueprints to implement exactly what you’ve designed in KPI Composer. You’ll be able to generate a to-do list of all the indicators and breakdowns an implementer will need to configure in your instance of Performance Analytics, so your teams or partner can deliver exactly what your business requires.
Generate a detailed to-do list of implementation tasks
We’re very excited to get this tool into your hands and can’t wait to hear your feedback! Be sure to check out the official documentation and free, self-paced training course for more guidance and information about how to use KPI Composer.
- 16,649 Views
14 Comments
- « Previous
-
- 1
- 2
- Next »
You must be a registered user to add a comment. If you've already registered, sign in. Otherwise, register and sign in.
