


Adam Stout

ServiceNow Employee
Options
- Subscribe to RSS Feed
- Mark as New
- Mark as Read
- Bookmark
- Subscribe
- Printer Friendly Page
- Report Inappropriate Content
06-12-2020
12:32 PM
Whether you have spent years working with ServiceNow or are brand new, the first time you see a dashboard like this, you might get stumped. It can be particularly confusing why it shows up for one user but not another.

Accessibility Options
Each user has the option to enable and disable several accessibility options, which will affect your experience in the instance. Click on the gear icon in the top right corner of your screen.
That will bring up the System Settings menu. On the Accessibility tab, two options will have a large impact when viewing a dashboard. [Note: Prior to New York, these two options were located in the General section instead of the Accessibility section which was added in New York.]
The two we will focus on are:
- Data visualization patterns enabled
- Accessibility enabled
Example Dashboard
To understand what each of these options does, we’ll look at this example dashboard and then enable each option one at a time.
Here is the dashboard with both options off.
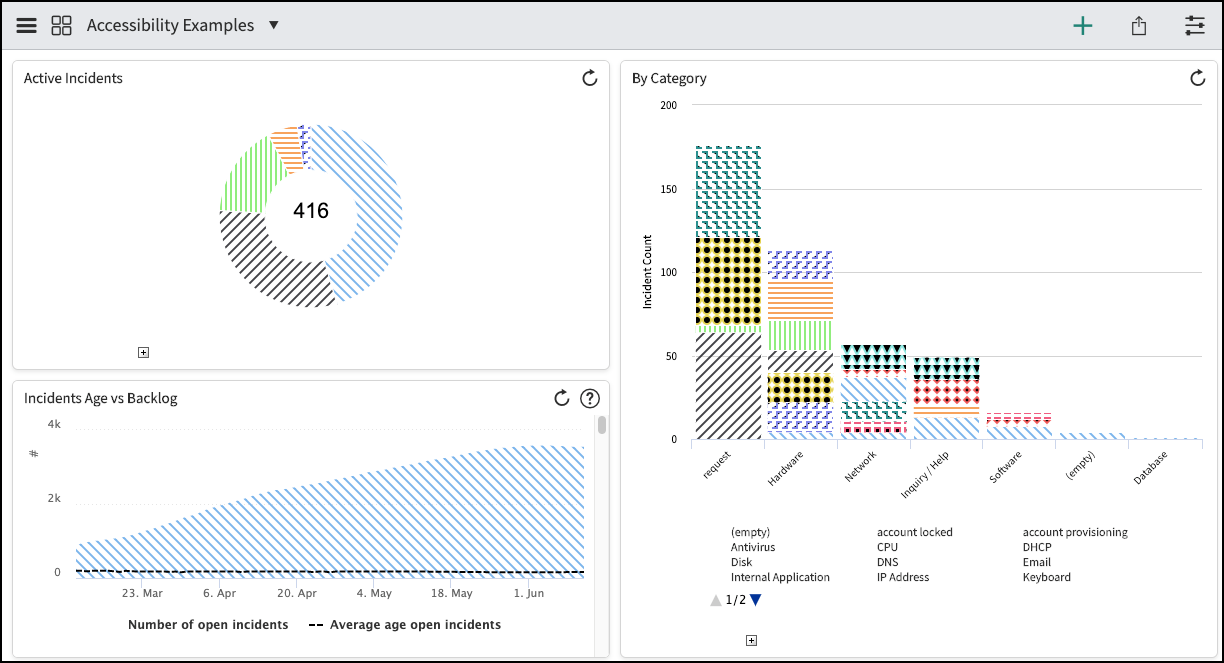
Data visualization patterns enabled
Now, we’ll turn on the Data visualization patterns enabled option.
With this option enabled, the solid colors in visualizations change to different data patterns.
Accessibility enabled
Next, we’ll turn on the Accessibility enabled option.
At first glance, nothing changed, but let’s look a little closer. There is a little + sign at the bottom of the reports.
When we click on that, a data table will appear. This will appear regardless of the data table option on the report.
For Performance Analytics widgets, the behavior is slightly different. The data table will show up below the chart and will need to scroll down to see it.
Conclusion
Accessibility options are vital to ensuring that all users can effectively use ServiceNow, but if they are unintentionally enabled, they can confuse the user. If you see data tables or patterns unexpectedly, be sure to check the Accessibility options for the user.
- 3,900 Views
3 Comments
You must be a registered user to add a comment. If you've already registered, sign in. Otherwise, register and sign in.

