- Mark as New
- Bookmark
- Subscribe
- Mute
- Subscribe to RSS Feed
- Permalink
- Report Inappropriate Content
02-16-2021 02:39 AM
Hi,
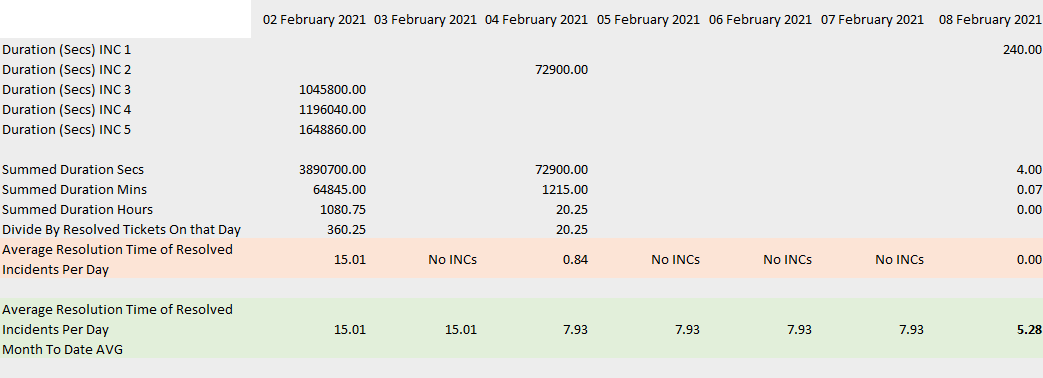
I have a business requirement in performance analytics to show a trend for the 'Average Resolution Time of Resolved Incidents' with a 'Month To Date AVG' time series. I appreciate this requirement is the average of an average.
All the options are there in PA widgets to support this view and was straight forward to add to a dashboard.
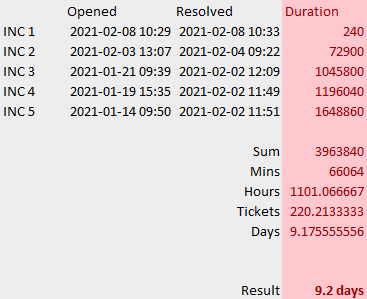
However, on calculating the data to check it, I came up with a different value. Here is what I did for the 5 incidents that were created from the start of the month and is also what the business expected. Sum the duration up of the incidents in seconds, convert to hours, average them by the number of incidents and then convert to days.

The result in PA was different and here is how I calculated what PA is doing for these 5 incidents.

The PA approach is different to what the business wants.
- Calculate the average resolution time each day, for the incidents on each day - Daily
- For 'Month to Date AVG', for each day calculate the average daily score for that month
I wasn't able to convince our business enough that the PA approach is the right one and am looking for some expert guidance.
Cheers!
Solved! Go to Solution.
- Labels:
-
Performance Analytics
- Mark as New
- Bookmark
- Subscribe
- Mute
- Subscribe to RSS Feed
- Permalink
- Report Inappropriate Content
02-16-2021 06:43 AM
I had this exact issue, and the business refused to understand. So I built a Daily Widget and then built a single score for the Monthly Average and calculated it correctly.
I would expect the results to be 15.01 on Feb 2, then 11.47 on Feb 4 and finally 9.18 on Feb 8
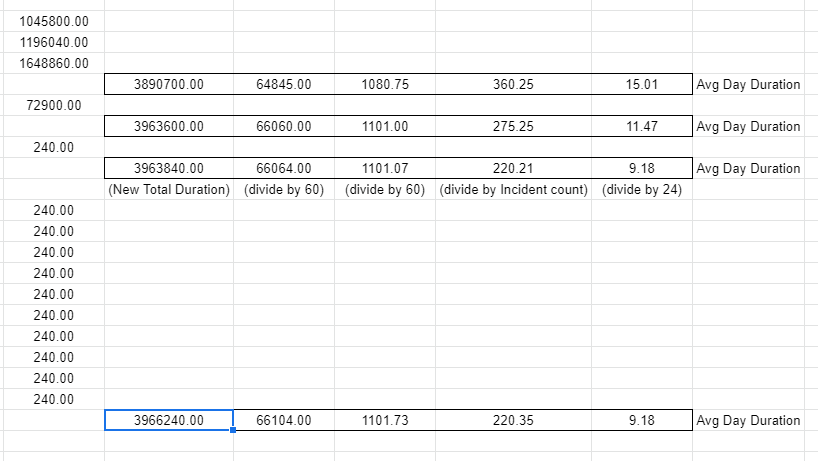
Here is the math I used - which matches what you used

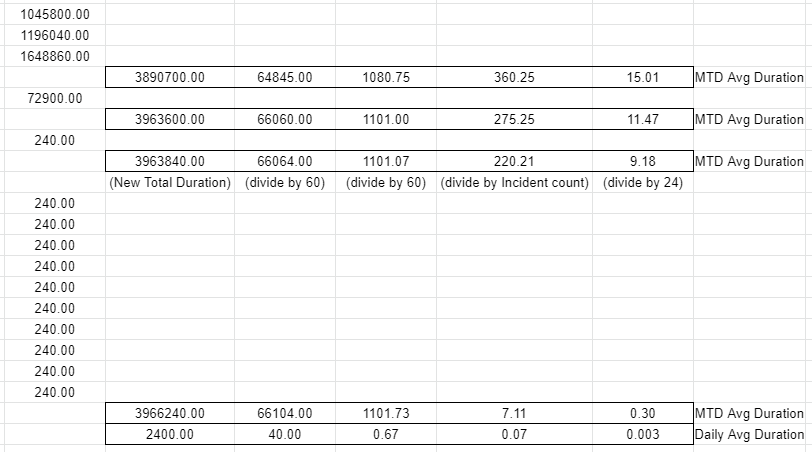
The conversation I had with the business was that looking at this average duration and making business assumptions was incorrect. The example I used, was that if there was an influx of 10 incidents on Feb 9 all resolved in 240 seconds - the result would be really affected

This is where the question you ask the business then becomes - do they care that on the first duration was 15 days, and now on the ninth duration is 0.3? What is the business problem they are trying to solve with the average duration.
When I broke out the daily and the Month to Date - they started ignoring the month to date number.
Good luck - your logic is solid, the business needs to see some example of these types of results.
- Mark as New
- Bookmark
- Subscribe
- Mute
- Subscribe to RSS Feed
- Permalink
- Report Inappropriate Content
02-16-2021 06:43 AM
I had this exact issue, and the business refused to understand. So I built a Daily Widget and then built a single score for the Monthly Average and calculated it correctly.
I would expect the results to be 15.01 on Feb 2, then 11.47 on Feb 4 and finally 9.18 on Feb 8
Here is the math I used - which matches what you used
The conversation I had with the business was that looking at this average duration and making business assumptions was incorrect. The example I used, was that if there was an influx of 10 incidents on Feb 9 all resolved in 240 seconds - the result would be really affected
This is where the question you ask the business then becomes - do they care that on the first duration was 15 days, and now on the ninth duration is 0.3? What is the business problem they are trying to solve with the average duration.
When I broke out the daily and the Month to Date - they started ignoring the month to date number.
Good luck - your logic is solid, the business needs to see some example of these types of results.
- Mark as New
- Bookmark
- Subscribe
- Mute
- Subscribe to RSS Feed
- Permalink
- Report Inappropriate Content
02-17-2021 01:58 AM
Thank you so much for giving the time to share your experience. I must admit, when writing the post I was in two minds whether to post or not but I am now glad that I did.
You have put me on the right track with a good example to go back to the business for another conversation on a tricky subject.
- Mark as New
- Bookmark
- Subscribe
- Mute
- Subscribe to RSS Feed
- Permalink
- Report Inappropriate Content
02-16-2021 07:00 AM
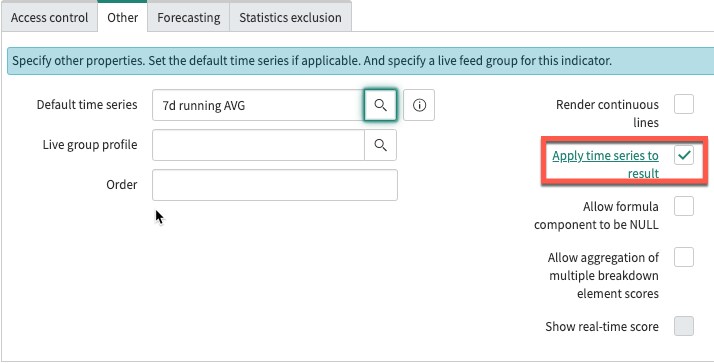
You may also want to explore unchecking "Apply time series to result" option in the formula indicator which would not apply average the averages and may be more in line with the numbers you are looking for.
For details, refer to the doc here

- Mark as New
- Bookmark
- Subscribe
- Mute
- Subscribe to RSS Feed
- Permalink
- Report Inappropriate Content
02-17-2021 02:06 AM
Thanks Amit, I will give that a read. Appreciate your time.