- Mark as New
- Bookmark
- Subscribe
- Mute
- Subscribe to RSS Feed
- Permalink
- Report Inappropriate Content
03-25-2018 07:29 AM
Hello everyone,
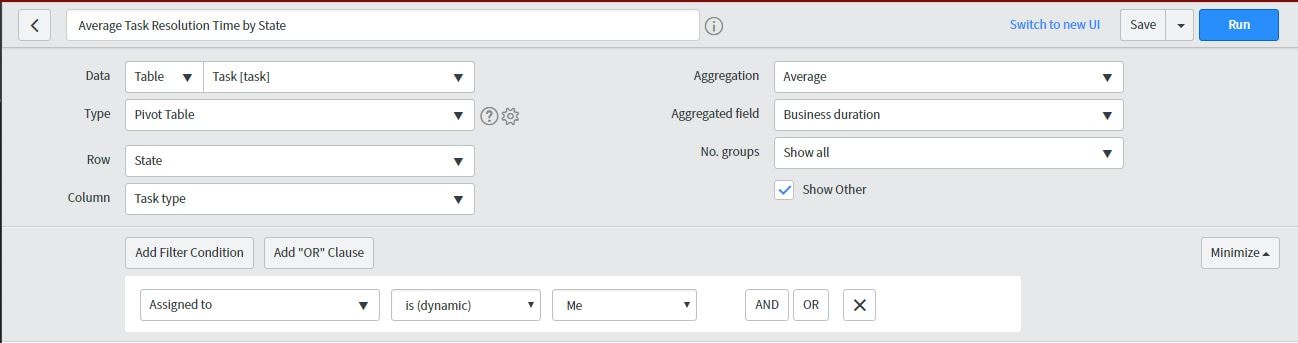
I have created a report that should bring the average of the business duration of each state per task type.

But the result wasn't as expected.
The only results that came back were the states of "resolve" and "closed" from the incident and "Awaiting user Info" from the problem as per the screenshot:

Please advise me if I have something wrong or missing or any alternatives that will bring the same results.
Thank you in advance and best of regards,
Solved! Go to Solution.
- Mark as New
- Bookmark
- Subscribe
- Mute
- Subscribe to RSS Feed
- Permalink
- Report Inappropriate Content
03-25-2018 09:39 AM
It sounds like you are going to want to look at using metrics. However, metrics typically only look at calendar duration, not business duration. However, you can do this with a scripted metrics that calculate the business duration per state. The complication comes in figuring out what schedule and timezone to calculate the business duration on but as long as you can work out that logic, it is very doable.
- Mark as New
- Bookmark
- Subscribe
- Mute
- Subscribe to RSS Feed
- Permalink
- Report Inappropriate Content
03-25-2018 11:21 PM
Thank you Adam for your reply, I think you are right but why only a few states are counted and other not actively even the same state of one process is counted and on other process is not (Incident and problem resolved).
appreciate your reply and support.
- Mark as New
- Bookmark
- Subscribe
- Mute
- Subscribe to RSS Feed
- Permalink
- Report Inappropriate Content
03-26-2018 06:41 PM
The normal (that is, non-Performance Analytics) reporting in ServiceNow is always a point-in-time snapshot of the current state of the system. Even for report types like trend, it can only report on timestamps as they are currently set.
In this case, it looks like in the state of your system as of the time you ran that report, you had no catalog tasks, no defects, no epics, no private tasks, no requested items, no scrum tasks, and no stories assigned to you. Likewise, none of your tickets were in a testing, ready for testing, draft, scoping, delivered, pending customer, ready, work in progress, awaiting problem, awaiting change, pending vendor, pending information, or on hold state.
Adam's suggestion about using metrics is because metrics is a mechanism of capturing historical information about a ticket, such as when the state changed.
If you know for a fact that you have tickets assigned to you in either one of the states listed above or in a state that doesn't show up in the report, it's likely because your task states have gotten out of sync. If a value of, for example, 12 on one table represents one state (such as "Pending Other" on the Incident table) but represents a different state on a different table (such as "Under Investigation" on the Problem table) and you run a query against the task table, one or both of these values may be obscured from reporting. That's kind of an obscure problem but one we've run into frequently because the people who have maintained our instance prior to our current team created all sorts of unsynchronized task states across our extended tables.
If you need help with setting up metrics to take business schedules into account as Adam mentioned above, post a message and I can see if there's anything I can do to help.
Hope this helps,
--Dennis R
- Mark as New
- Bookmark
- Subscribe
- Mute
- Subscribe to RSS Feed
- Permalink
- Report Inappropriate Content
04-02-2018 08:42 AM
Adam is correct - you'll need to drive this through metric, or reconsider how to report on it. The issue is that the business duration field that you're using is a field that automatically calculates using a business rule when the ticket is resolved.
There are some metrics against almost all of the tickets though related to state duration and open to close duration, that you can see in the incident_metric table. If you want to display fields from that table along with fields from the incident/problem/request itself, then you can look at the appropriate database view - however those are seperate tables now... incident_metric, problem_metric, request_metric. They're just a database join basically between incident_metric and incident, problem, and request respectively.
For running durations and times, for example if you have a goal of 8 hours to complete and you're trying to track time elapsed toward that goal, then you should consider setting it up as an SLA (technically an OLA, but set up pretty much the same way). It has more detailed time tracking and even allows for pause conditions that stop the clock, if that's applicable. Then you can report on those tables the same as an incident metric table (task_sla is the main table, incident_sla, problem_sla, request_sla should be the database views for those.)
If you want to pursue the method of creating a business duration metric, then as I mentioned earlier there's a business rule that runs on task that calculates business_duration field when the ticket enters 'resolved' state. That means when you build your custom metric, you have a place that you can look to get an idea of what the code should look like. Just right click in the incident table for example and Configure Business Rules - add the Script field to your view by personalizing tables, and search for the business_duration field name (or whatever field name it's updating). You should find it pretty quickly!