Change the color of individual Bars in Time Series basicr Report
- Mark as New
- Bookmark
- Subscribe
- Mute
- Subscribe to RSS Feed
- Permalink
- Report Inappropriate Content
01-30-2022 11:21 AM
Hello,
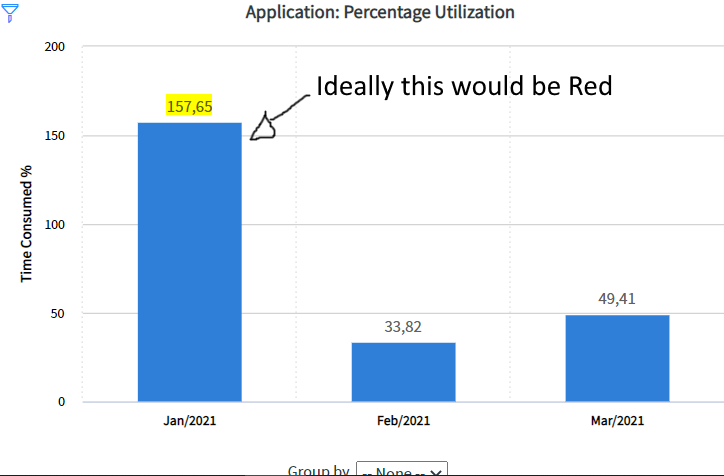
I am trying to format a table to change bar colors once value passes 100, I've tried color charts and Chart Color Schemes but once configured I can't access them as seen in the 2nd picture. Is there a way to do this? Change the color of bars individually on a basic Time Series report?

I only find one option:
Thank you for your time,

Best regards,
- Mark as New
- Bookmark
- Subscribe
- Mute
- Subscribe to RSS Feed
- Permalink
- Report Inappropriate Content
01-30-2022 01:07 PM
Hi,
Once you set a group by field value on the report, the other color choices will appear. Otherwise, it's limited in this scenario to just one color.
Unfortunately, you're not able to set the color based off of aggregation like that. You can set it based off of value, like if you selected a group by field with selections, then you can choose by selection value, but not aggregation.
Please mark reply as Helpful/Correct, if applicable. Thanks!
Please consider marking my reply as Helpful and/or Accept Solution, if applicable. Thanks!