Create Trend Chart with both Bar and Trend Line
- Mark as New
- Bookmark
- Subscribe
- Mute
- Subscribe to RSS Feed
- Permalink
- Report Inappropriate Content
08-17-2017 10:19 AM
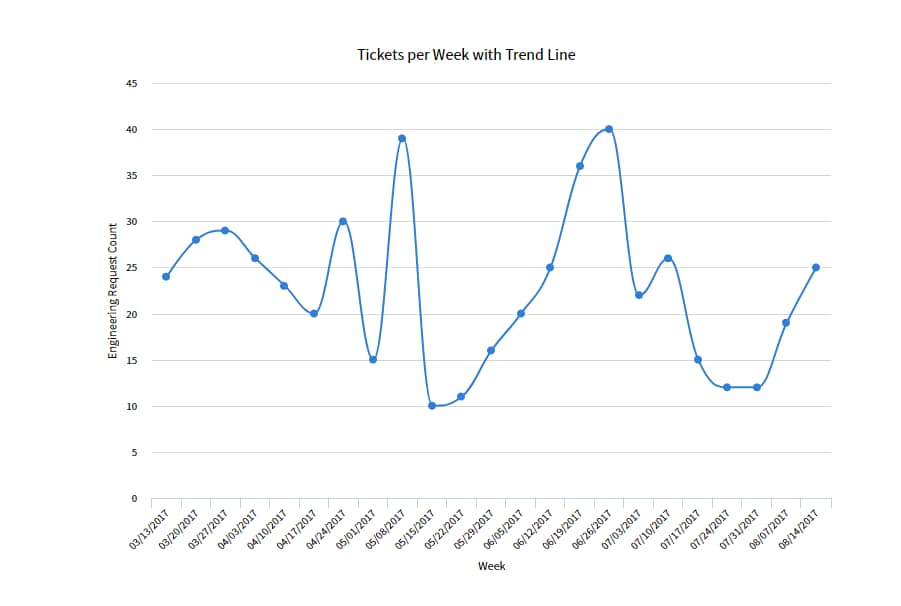
This may be an odd request, but I've been tasked with making it happen, if it's possible. Currently, one of our departments is using a trend chart showing number of tickets opened per week. It looks like this:

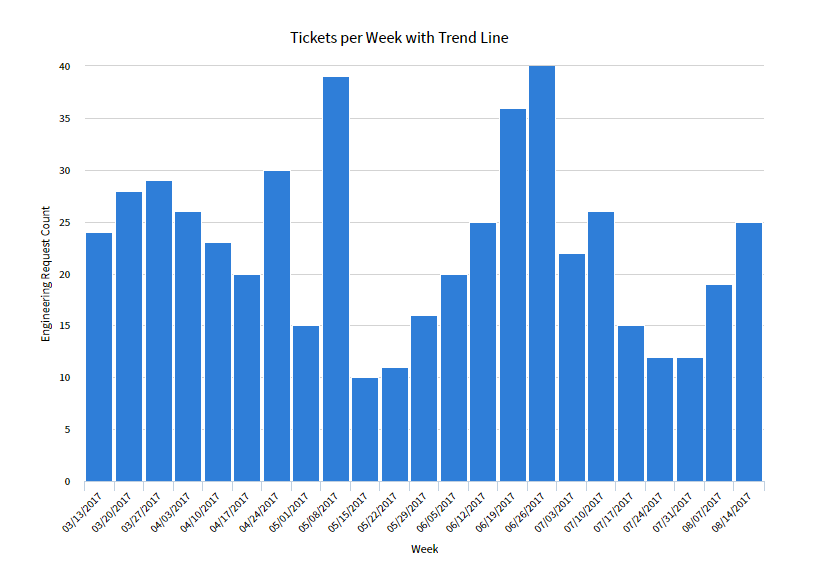
I can find one that looks like this:

But what they want is a report that looks like this (it includes both the bar AND the line):

Is this possible in ServiceNow? (They're sample report is from another system entirely.)
- Labels:
-
Performance Analytics
-
Reporting
- Mark as New
- Bookmark
- Subscribe
- Mute
- Subscribe to RSS Feed
- Permalink
- Report Inappropriate Content
08-17-2017 10:59 AM
Yes! In reporting, after you have create your first data set, you have to save your report. Once you have saved your report you can choose Multi Dataset option from the menu. This will allow you add a different data point and a different chart type. Available from Helsinki.
- Mark as New
- Bookmark
- Subscribe
- Mute
- Subscribe to RSS Feed
- Permalink
- Report Inappropriate Content
08-17-2017 12:25 PM
This worked, thank you very much.
- Mark as New
- Bookmark
- Subscribe
- Mute
- Subscribe to RSS Feed
- Permalink
- Report Inappropriate Content
01-08-2021 05:15 AM
Hi Tara Romero,
I have the same requirement. Could you please help me where can I find Multi Dataset option with the screenshot.
Regards,
Deepak K
- Mark as New
- Bookmark
- Subscribe
- Mute
- Subscribe to RSS Feed
- Permalink
- Report Inappropriate Content
01-08-2021 06:10 AM
Hi Deepak,
This link articulates the process for adding multiple datasets:
Thanks,
DJL