- Mark as New
- Bookmark
- Subscribe
- Mute
- Subscribe to RSS Feed
- Permalink
- Report Inappropriate Content
12-04-2017 08:34 AM
Is there a way to choose what colour each segment is (Segment meaning the sections when you 'stack' a bar chart). Then i want these to be the same colour in multiple reports (So if in another report, a particular value has no results, then that value's colour is not used)
Solved! Go to Solution.
- Labels:
-
Reporting
- Mark as New
- Bookmark
- Subscribe
- Mute
- Subscribe to RSS Feed
- Permalink
- Report Inappropriate Content
12-04-2017 10:56 AM
Maymun,
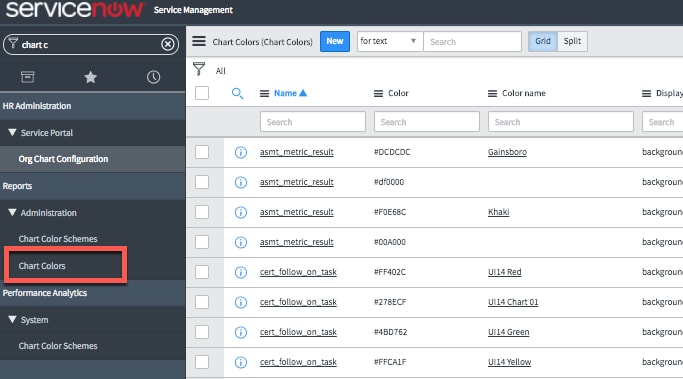
If you want to assign a specific color to an attribute (e.g. All incidents assigned to the Security Group will be #dcdcdc - Light Grey) , you can set this up under "Chart Colors". Once the colors are set, you will see the option to use the chart colors if they are defined...which should accomplish what you want.....


- Mark as New
- Bookmark
- Subscribe
- Mute
- Subscribe to RSS Feed
- Permalink
- Report Inappropriate Content
12-04-2017 08:39 AM
Please check below threads which has solutions to same question.
Regards,
sachin
- Mark as New
- Bookmark
- Subscribe
- Mute
- Subscribe to RSS Feed
- Permalink
- Report Inappropriate Content
12-04-2017 08:45 AM
I don't quite see the answer to my question here... I know how to change the colours of a report, but i want to make each value in the legend to have a colour specified by me
- Mark as New
- Bookmark
- Subscribe
- Mute
- Subscribe to RSS Feed
- Permalink
- Report Inappropriate Content
12-04-2017 10:56 AM
Maymun,
If you want to assign a specific color to an attribute (e.g. All incidents assigned to the Security Group will be #dcdcdc - Light Grey) , you can set this up under "Chart Colors". Once the colors are set, you will see the option to use the chart colors if they are defined...which should accomplish what you want.....
- Mark as New
- Bookmark
- Subscribe
- Mute
- Subscribe to RSS Feed
- Permalink
- Report Inappropriate Content
12-05-2017 01:43 AM
Ah ok, and if i define this, will it be the case for any other non-admin users who create reports?