- Mark as New
- Bookmark
- Subscribe
- Mute
- Subscribe to RSS Feed
- Permalink
- Report Inappropriate Content
04-06-2021 04:56 PM
- Mark as New
- Bookmark
- Subscribe
- Mute
- Subscribe to RSS Feed
- Permalink
- Report Inappropriate Content
04-07-2021 06:23 PM
That's a bit trickier, but it can be done.
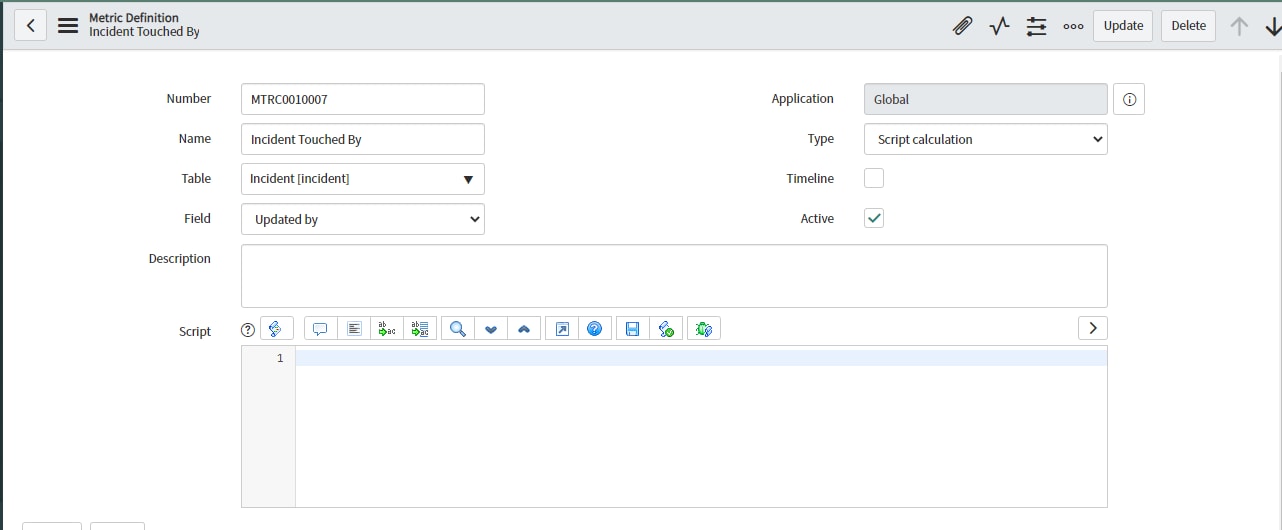
We first need to create a metric definition. Set the type to script calculation and the table to incident. Leave the script field blank, we will be using a business rule to create the instances.

Now we need to create a metric instance each time a user does something to the incident. We can accomplish this with a business rule.
Create a new business rule that runs on inserts and updates to the incident table. The rule will create an incident metric each time the incident is updated by a user. This counts all changes to the incident as a "touch", including things like adding worknotes, changing the state or assignment group.

Check the "advanced" checkbox and go the the advanced tab. Then paste in the following script. Make sure to replace the sys_id to the one of the metric definition you just created:
(function executeRule(current, previous /*null when async*/) {

    var definition = '1ce280cf0753ac10da6cff4c7c1ed0b2'; //sysid of the metric definition
	var user = gs.getUserID();
	var currentTime = new GlideDateTime();

    var mi = new MetricInstance(definition, current, user, currentTime);
    var nr = mi.getNewRecord();
    nr.id = current.getUniqueValue();
    nr.definition = definition;
    nr.field = 'sys_user';
    nr.field_value = user;
    nr.start = currentTime;
    nr.calculation_complete = true;
    nr.insert();

})(current, previous);
This business rule creates a metric capturing the users sys_id each time the record is updated:

We capture the user since that's really all we know. A user can be a member of multiple groups, so we don't know which of the user's groups "touched" the incident. Say I am a member of the database group and the windows server group and I update an incident. Was it the database group or the server group that touched the incident?
What we can do is to join our metrics in a database view to the sys_user_grmember table. That way, we get a row for each possible group that could be regarded as having touched the incident, i.e. each group the updating user belongs to. If your users only belong to a single group, there will only be a single row for each metric instance:

The where-clause that is cut off in the picture is:
met.field_value = mem.user AND met.definition ='1ce280cf0753ac10da6cff4c7c1ed0b2'
Again, replace the sys_id with that of you metric definition.
This will create a table containing the groups that can be seen as having touched the incident, based on the updating user's group membership. We can then create an indicator source on this table and filter out rows for a specific group, and then count the distinct ID values in an indicator.
In this example, I added a work note to INC0010055 using the account of Beth Anglin. She is a member of 8 groups, so we get 8 rows in our database view.

One thing to remember is that since this DB view is based on the group membership table, if we remove a user from a group that will remove the rows for that group for all metrics. Since you are using PA that wont be an issue, the scores for the groups will be saved in the PA scores table and wont be affected by changes to previous days data in the source table. But if you were using reporting, removing a user from a group would affect all historic "touches" for that group.
- Mark as New
- Bookmark
- Subscribe
- Mute
- Subscribe to RSS Feed
- Permalink
- Report Inappropriate Content
04-06-2021 05:12 PM
Hi,
You need to report on either metric instances or SLA breakdowns.
The first option requires you to set up a metric definition, for example a field duration metric, that creates a metric instances each time the assignment group of an incidents changes. You can then create a indicator source for the metric_instance table (or a database view joining this table to incident) and map the assignment group breakdown to the metric instance field value. An indicator based on this source can then use count distinct to get the number of incidents that were at some time assigned to each group (breakdown).
The other option would require you to setup SLA breakdown definitions for each SLA definition that you would like to report on. The concept is very similar to metrics, only that it's based on the assignments of the SLA record's parent task. The SLA breakdown will contain additional details as well as data for the combination of assignment group and assigned to, and the SLA elapsed during that assignment. The process for building the indicator and indicator source is similar. The source needs to point to the sla_breakdown_by_definition table, and you can then count the distinct incident numbers from that.
The second option will work only for incidents that have an SLA attached to them. The first will work for all incidents. The positive of the second solution is that it captures more data. Neither solution will generate data retroactively. That cannot be done as that data is stored in the sys_audit table which cannot be reported on. Although I do believe there is a metric for incident assignment group active by default, so you might already have that data collected.
- Mark as New
- Bookmark
- Subscribe
- Mute
- Subscribe to RSS Feed
- Permalink
- Report Inappropriate Content
04-07-2021 04:28 PM
Hi
My progress so far
I have created a Metric for incident Touched using the script given here
https://community.servicenow.com/community?id=community_question&sys_id=8805cb2ddbd8dbc01dcaf3231f9619f0
Here is the script
(function calculateMetric(current, definition, mi) {


      // Check to see if a metric instance already exists for this ticket


      // assigned to this assignment group


      var grMetric = new GlideRecord('metric_instance');


      grMetric.addQuery('id', current.getValue('sys_id'));


      grMetric.addQuery('definition', definition.getValue('sys_id'));


      grMetric.addQuery('value', current.getDisplayValue('assignment_group'));


      grMetric.query();


      if (grMetric.hasNext()) {


              // If so, then this ticket has already been counted for this assignment


              // group and there's no need to do anything.


      }


      else {


              // If not, create one


              var now = new GlideDateTime();


              var instant = new GlideDuration(0);


              grMetric = new GlideRecord('metric_instance');


              grMetric.initialize();


              grMetric.setValue('table', current.getRecordClassName());


              grMetric.setValue('id', current.getValue('sys_id'));


              grMetric.setValue('definition', definition.getValue('sys_id'));


              grMetric.setValue('field', definition.getValue('field'));


              grMetric.setValue('value', current.getDisplayValue('assignment_group'));


              grMetric.setValue('duration', instant);


              grMetric.setValue('business_duration', instant);


              grMetric.setValue('calculation_complete', true);


              grMetric.setValue('start', now);


              grMetric.setValue('end', now);


              grMetric.insert();


      }


})(current, definition, mi);
I am creating an indicator source with the conditions in the screenshots and then an indicator. But the results are not even close to being accurate. Could you please help me. Let me know if you need more infoo. Thanks

- Mark as New
- Bookmark
- Subscribe
- Mute
- Subscribe to RSS Feed
- Permalink
- Report Inappropriate Content
04-07-2021 05:02 PM
I don't really think you need to use that script. What makes that script unique is that it only creates one metric instance for each combination of task and assignment group.
Say you have the following task assignment history:
Task is opened by "Service Desk" on Monday.
Task is assigned to "Servicenow Support" on Tuesday.
Task is assigned to "Database Support" on Tuesday.
Task is assigned back to "ServiceNow Support" on Wednesday.
On Tuesday a metric would be created for the assignment to "Servicenow Support" for the task. But on Wednesday no new metric would be created, since a metric for that task and group already exists. So your report would not show that the group touched the task on Wednesday.
You're better off just using a standard field duration Metric definition for the assignment group field. Such a metric probably already exists in you instance. It would be configured like this. Notice that the type is "field value duration", not scripted:

This metric definition will create a new metric instance every time the assignment group changes. Here is an example of an incident I sent back and forward between the service desk and some other groups. These are the metric instances that will be created:

Your indicator source would then use the conditions:
Table: metric_instance (or a database view joining metric_instance to incident)
Definition: Assignment Group (MTRC0000006)
Start: [ON] [Today]
Value: ServiceNow Support
That indicator source would get one row (metric instance) for each time the incident was assigned to the ServiceNow support each day. You could create a simple COUNT indicator against the source to get the total number of "assignments" to that group each day. But if you wanted to report on the number of "incidents assigned" to that group, you would need to use a COUNT DISTINCT indicator set to look at the ID field of the metric.
In my example above, all the instances were for the same day and for the same incident. With a count indicator, the daily score for "service desk" would be 3. With a count distinct on ID the score for "service desk" would be 1.
I assume in your case you want to use a count distinct indicator as that would give you the number of incidents touched by the group, not the number of "touches" (assignments).
Remember that using a time series like "by month sum" on a daily count distinct indicator ruins that logic. If you want the number of unique incidents handled by the group in a month, you instead have to use a indicator and indicator source with a monthly frequency.
- Mark as New
- Bookmark
- Subscribe
- Mute
- Subscribe to RSS Feed
- Permalink
- Report Inappropriate Content
04-07-2021 05:21 PM
Thank you
Suppose I belong to ServiceNow Team, I add some worknotes on a ticket that was always assigned to SharePoint Team and is never going to be assigned to my team. I need to be able to include such incidents in my score.