How do I create a report that can show ticket closure times?
- Mark as New
- Bookmark
- Subscribe
- Mute
- Subscribe to RSS Feed
- Permalink
- Report Inappropriate Content
06-30-2022 04:17 PM
I'm looking to create a graph to show ticket closure times for all ticket types. E.g. X tickets closed same day, Y tickets closed 2 days etc. What config would I need to do this?
I've tried a few different set ups but the graph keeps adding the vast majority of tickets in the >2 months category but when I look at the data, the vast majority of those were closed same day so I know something is wrong.
Current config:
Group by: Closed
Aggregation: Count
Assignment group - is - Group 1 or
Assignment group - is - Group 2 and
Active - is - True or
Closed - on - Last 12 months
Note: We don't have Performance Analytics.
Would appreciate some suggestions on what I'm doing wrong here.
- Mark as New
- Bookmark
- Subscribe
- Mute
- Subscribe to RSS Feed
- Permalink
- Report Inappropriate Content
06-30-2022 09:08 PM
Hi Carike,
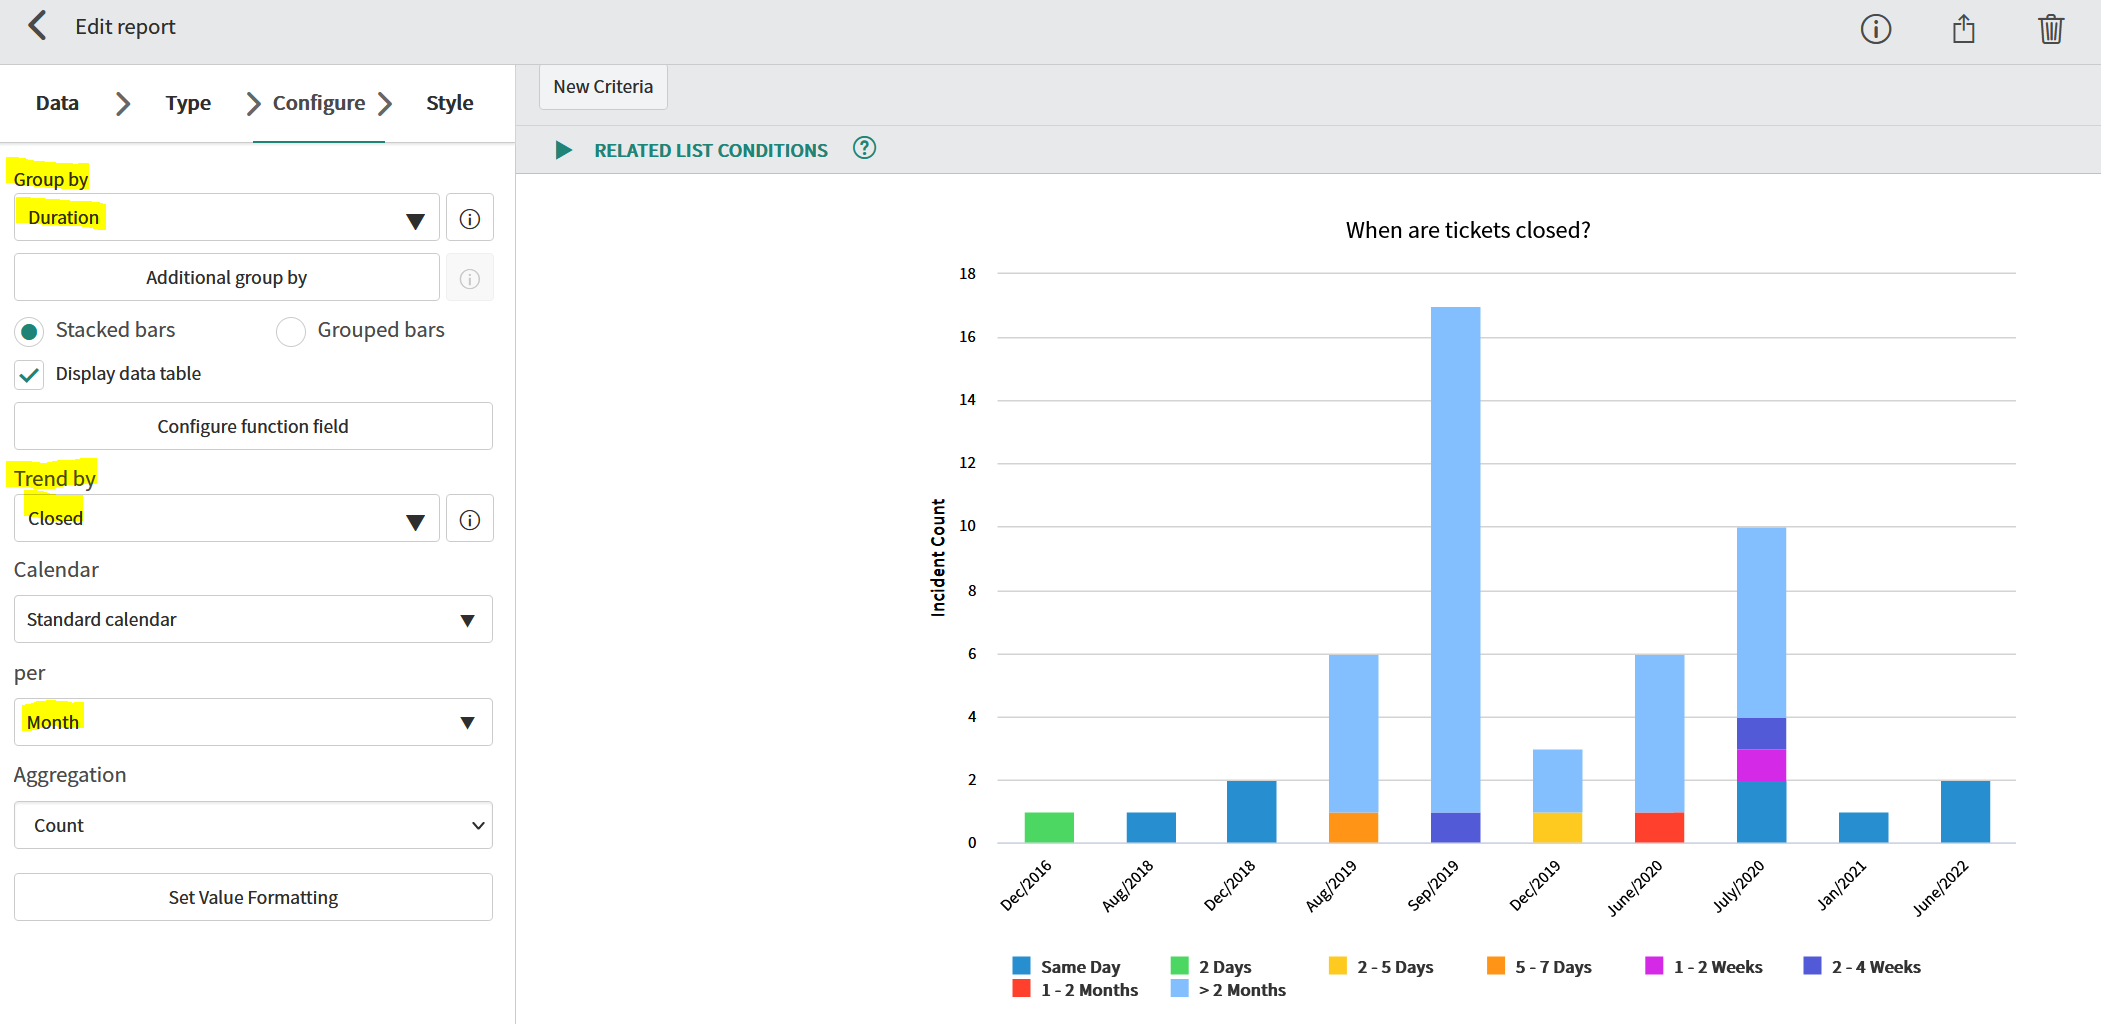
Do you mean you would like to get a report to see a graph showing the distribution of closed ticket duration? Ticket duration as in from the time of ticket opening to ticket closure. ServiceNow has a [duration] field on the [task] or [task] extended table that you can utilize.
You can group by the [Duration] field. For the filter, you can show only Active=False (closed) tickets, Closed on last 12 months, and Assignment Group = Group1 or Group2.
To visualize the stats, you can either use a bar graph like below:

Alternatively, you can also visualize it with a Time Series Column type report where you can break down the stats by ticket closure month for example.

Hope this helps!
Thanks,
Jenny
- Mark as New
- Bookmark
- Subscribe
- Mute
- Subscribe to RSS Feed
- Permalink
- Report Inappropriate Content
07-03-2022 07:36 PM
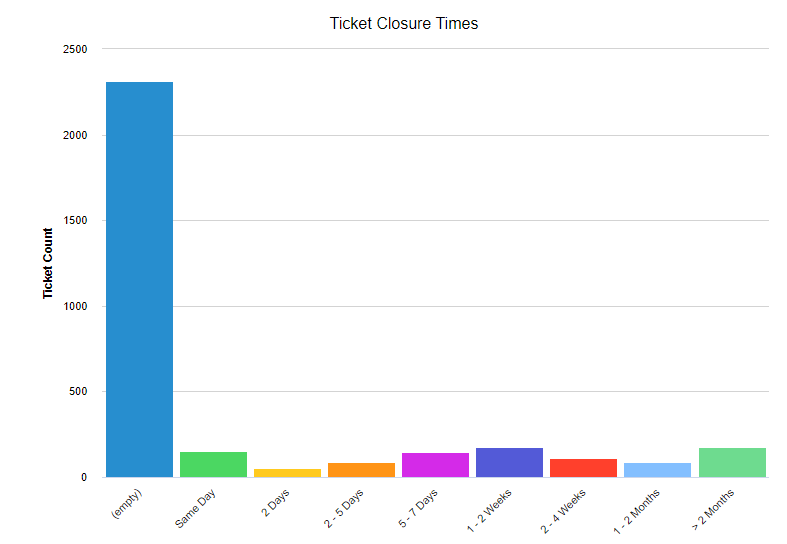
Hi Jenny
The first example is exactly what I'm looking for. I have made the suggested changes but note that it has now added a significant number of the tickets into the 'empty' category. When I look at the data included in that category, they all have closure dates / times. Do you know what field could be causing this?

- Mark as New
- Bookmark
- Subscribe
- Mute
- Subscribe to RSS Feed
- Permalink
- Report Inappropriate Content
07-05-2022 07:51 PM
Hi Carike,
I'm glad you almost got the results you'd like. Without knowing the table you report on and the filter conditions, I can't really know what caused the odd behavior. Is this the incident table? I would dig into how the duration field is calculated. If this is the incident table, here's a KB article on how the duration field is calculated:
https://support.servicenow.com/kb?id=kb_article_view&sysparm_article=KB0754082
Now to think of it, a better way might be to report on the metrics table. Take a look at the out of the box "Create to Resolve" Metric Definition as an example:
https://[your-instance].service-now.com/nav_to.do?uri=metric_definition.do?sys_id=35edf981c0a808ae009895af7c843ace
Hope this helps!
Thanks,
Jenny
- Mark as New
- Bookmark
- Subscribe
- Mute
- Subscribe to RSS Feed
- Permalink
- Report Inappropriate Content
07-05-2022 06:25 PM
Posting to move my help request / above response up:
Hi Jenny
The first example is exactly what I'm looking for. I have made the suggested changes but note that it has now added a significant number of the tickets into the 'empty' category. When I look at the data included in that category, they all have closure dates / times. Do you know what field could be causing this?
